The Ledger
Curated content foranalytical business leaders
Tag Archives: Allocation
CFO Journal: Check it Twice: A Checklist for Rethinking Capital Allocation
CFO Journal came up with a checklist for re-evaluating your allocations strategy – and here are some of the items on that list:
“Data. Do you have the data and insights you need to make informed decisions? Work with your stakeholders to determine what those are, where they need to come from, and how you can get them.
Tools. Where could data analytics, scenario planning, and risk-sensing tools improve your decision-making? Which tools do you already have, and which do you need? Engage your stakeholders on what data they need to generate from their business units.”
SF Magazine: The Four Levers of Revenue Management
4 key levers of revenue management modified from the Dupont ROI Framework:
- Pricing Basis
- Inventory Allocation
- Product Configuration
- Duration Control
Cost Allocations: Gaining Actionable Insights With Detailed Calculations
Organizations face growing pressure to control costs and enable effective financial management of their resources to deliver value. Business leaders need visibility into the cost of the products and services they provide to know if their business is profitable at a granular level. To get these insights, many implement a cost allocation methodology to make business units more accountable for the activities they perform and assigns the costs associated with these activities to the business units or cost centers based on their appropriate share of the cost.
A recent EY whitepaper, The Allocation Game, defines the practice of cost allocations as “managing costs before any money is spent.” An effective cost allocation methodology enables an organization to reduce costs by identifying what services are being provided and what they cost, allocating costs to business units, and managing cost recovery.
Cost allocations are key to determining how much it costs to manufacture products and serve customers while answering strategic questions that drive corporate decisions like, “Which customers or products are profitable?” or “What activities are driving costs?”. The goal is allocating or assigning costs based on root causes or drivers, instead of simply spreading the costs evenly. However, finding the right allocation methodology that provides fully loaded cost information that leads to actionable business insights can be a challenge. The Dinner Check Method is a simple, yet effective way to explain the different cost allocation methods, and why some of them lack cost transparency.
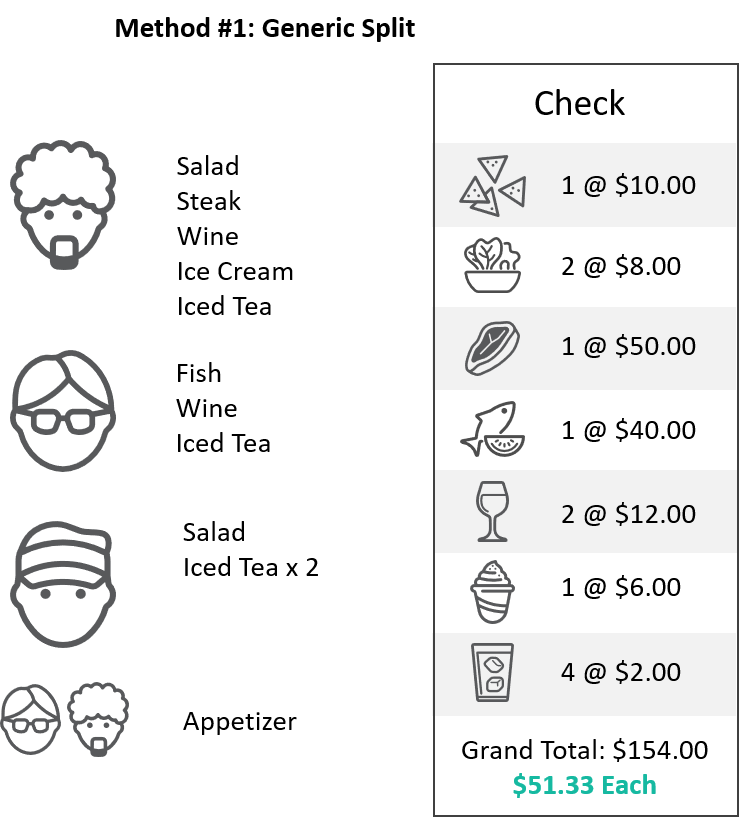
Three friends have dinner. The generic split method divides the check evenly among three friends, even though they all individually ordered something different. Each person pays the exact same amount regardless of what they ordered, which isn’t entirely fair to any of the friends.
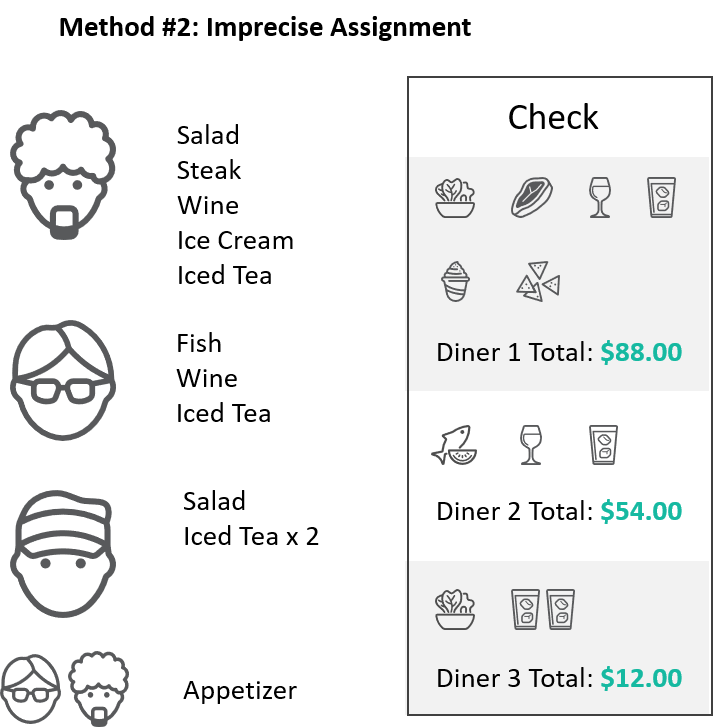
The second method is a bit more accurate since it assigns some items properly, but it’s not entirely right. In our example, Friend 2 pays the correct amount while Friend 1 gets stuck with the entire appetizer, even though he shared it with Friend 3. Better? Yes. Precise? Not really.
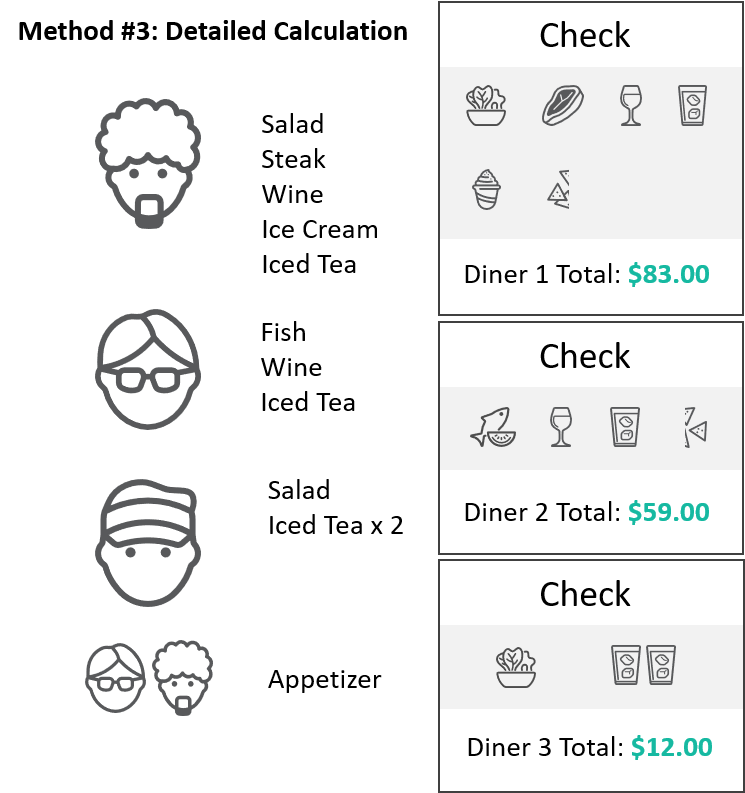
In our final example, each of the items is assigned to each friend based on what they consumed individually, making sure that each person is financial responsible for the items they ordered and how much they ate. This approach is the most equitable, but also the hardest to track and calculate.
It’s All About the Drivers
Just like the Dinner Check Method, companies must decide the best way to “split the check” when it comes to allocating the direct and indirect spending associated with manufacturing, selling, and supporting products. Our widget manufacturer makes three different widgets, each with different attributes that drive costs – one is expensive to setup, one uses lower-skilled workers that are less expensive, and one uses cheaper commodity materials.
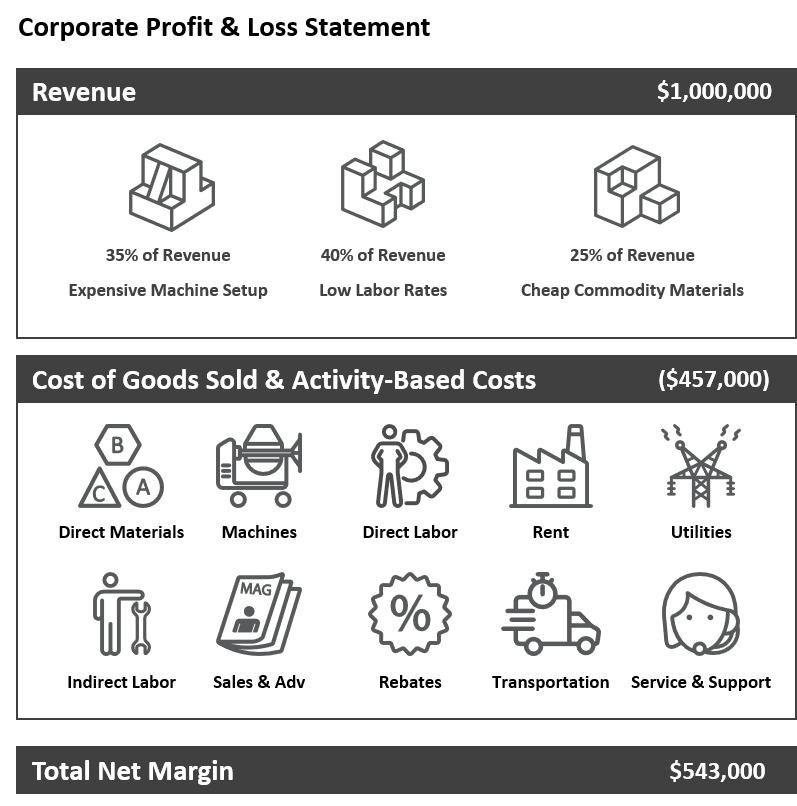
The widget company generates $1,000,000 in revenue selling the three widgets, but spends about 45% of it for all of the production costs, overhead expenses and post-production activities. How can they figure out which of the three widgets is profitable? You can pick an arbitrary allocation rule – say revenue share – and assign the costs to each product using simple math. Using this method, it appears that Widget 2 is the most profitable.
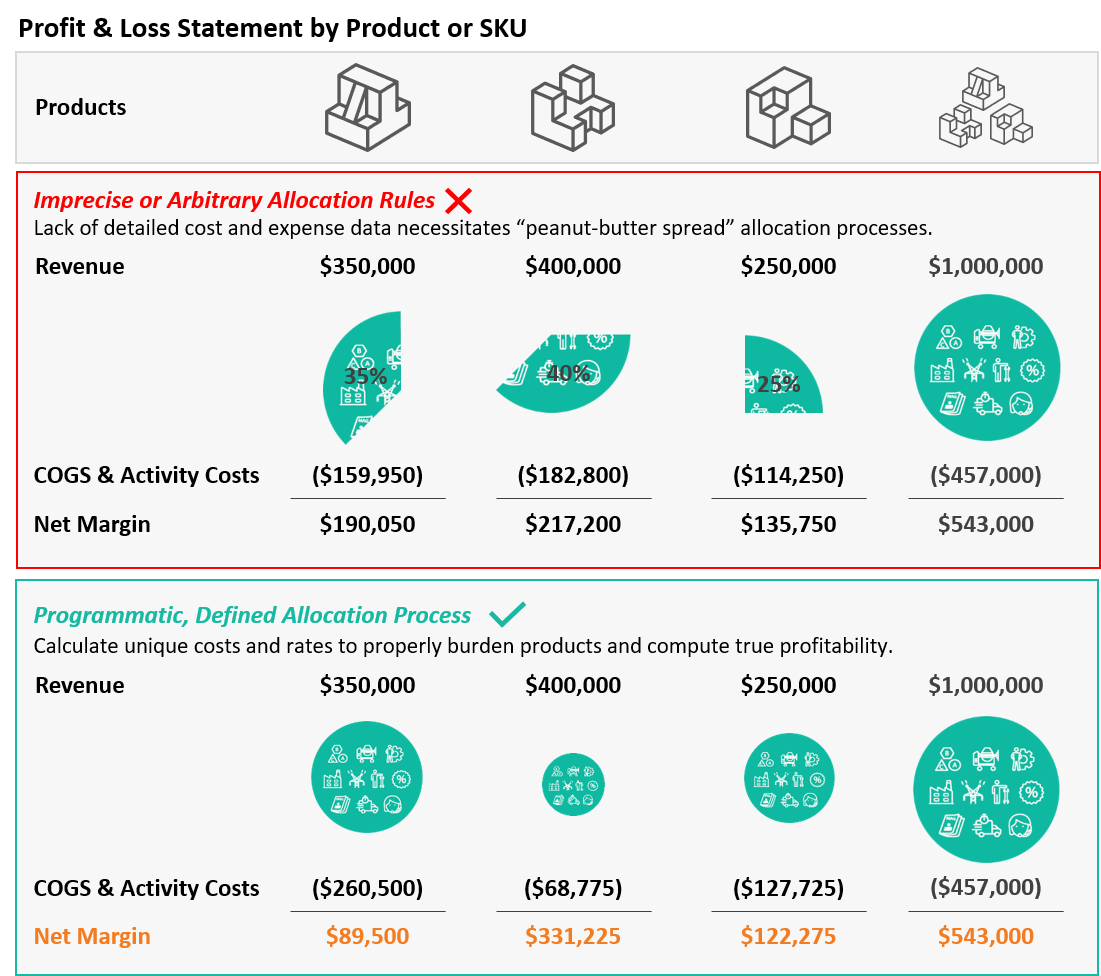
But is it really the most profitable? Remember the cost drivers we discussed earlier – expensive setup times, low labor rates, and cheap commodity products? By having a way to track those costs and allocate spending for each activity based on the specific ways each widget consumes them, it’s possible to unlock accurate COGS and activity costs which provides a more accurate margin calculation. And while we already thought Widget 2 was profitable, it’s even better than we imagined.
Imprecise allocation methods lack the detailed cost and expense data necessary for cost transparency, which leads to poor costing decisions and behaviors. Implementing a programmatic and defined allocation process enables actionable cost management. It redefines the cost allocation methodology to balance simplicity with the need for fully loaded costs, strengthen the link between drivers and business fundamentals, and improving data quality, all while driving down costs.
Establishing an Equitable and Accurate Allocations Process
Cost allocation methodologies are utilized to determine the true costs associated with customers, products and vendors. Outdated legacy systems coupled with the existence of multiple systems that house critical costing data contributes to the loss of transparency in cost allocation processes.
ImpactECS gives companies the ability to drive costs to unique products and SKUs. The first step to launching any allocations process is by bringing together – or pooling – relevant production and finance data from systems across the organization. Depending on the IT architecture, data from dozens of systems may be required to establish a central and harmonized data set. With this solid data foundation, the next step requires identifying the most appropriate and measurable drivers, and using this information to dynamically calculate allocation rates. These rates are used to assign expenses directly to products, giving meaningful and accurate insights into each product’s cost profile.
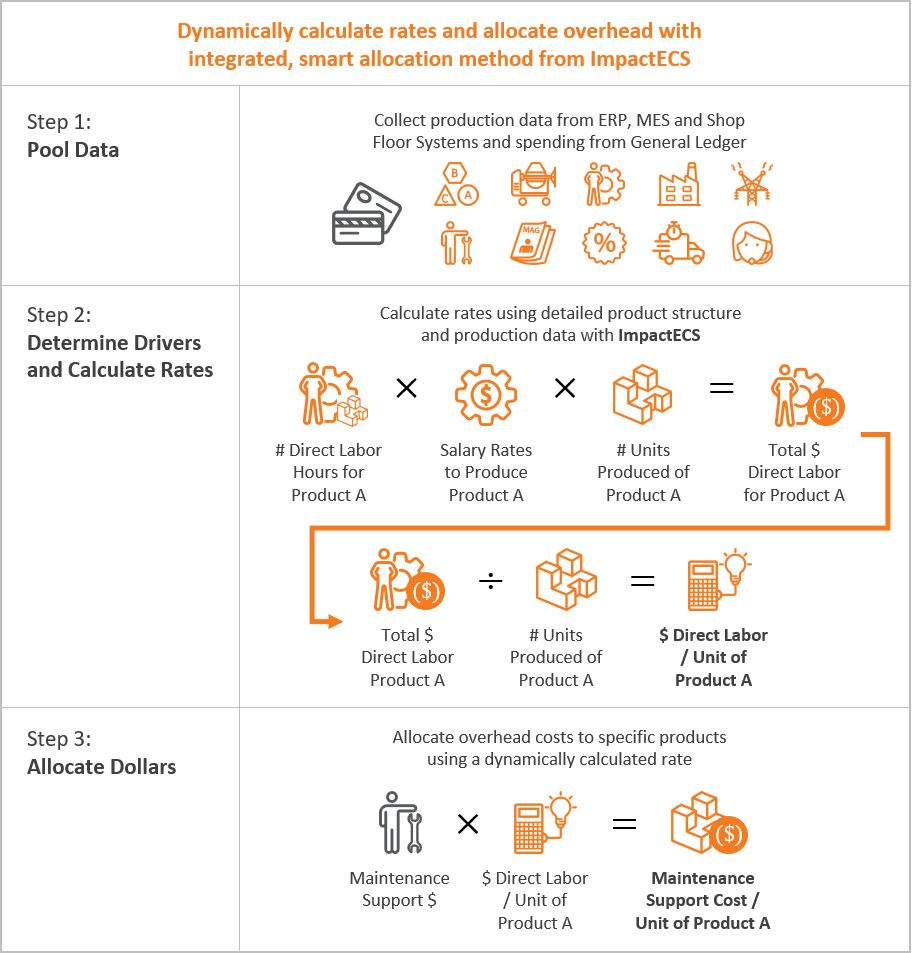
EY states, “A company’s ability to sustain cost management routines is rooted in its ability to embed cost control into business rhythm and cadence as well as integrate cost allocation within existing key processes such as financial planning, transfer pricing and pricing of critical services to generate a consistent view and understanding of costs within the organization.” Organizations looking to sustain their ability to manage costs and expand their competitive advantage through meaningful insights must dig into the details and get access to the granular cost detail critical to see true profits – one SKU at a time.
Companies of all sizes leverage ImpactECS for allocations and rate building processes designed to inform decisions and ultimately increase profitability. Visit us at www.3csoftware.com to learn more.
Four Steps to Calculating Process Costs

Process costing focuses on the direct and allocated costs associated with the operation of a given area of the manufacturing flow. Maybe it’s a work center, a cost center, or a specific production line, but what it really represents is an area where you want to determine the unique cost added to the product as a result of traveling through that area.
Step 1 – Collect Direct Spending
In order to calculate a process cost, the first thing you need is to collect the pools of direct spending at the account or sub-account level. These pools represent dollars that you plan to spend (or actually spend in the case of actual costs) in the area. Typical pools include labor, depreciation, and energy and the information is usually found in the general ledger.
Step 2 – Allocate Indirect Spending
Next, you need to focus on the spending that occurs outside the manufacturing areas based on the appropriate drivers. Trying to determine the most appropriate driver is sometimes challenging (see Picking the Right Driver Is Important To More Than Just Your Golf Game), but the focus should lie in finding a driver that you are able to measure and capture.
Step 3 – Calculate Cost Center Rates
Once you’ve pooled the dollars for the production area, you can then calculate rates expressed in dollars per “something”. That something depends on the rate. In most cases, the rate is stated in dollars per machine hour, dollars per batch, or even a simple dollars per unit produced rate. Now, you can keep the rates at the natural cost element or cost pool level so you’re able to use a unique driver for each rate and provides a better view of the composition of the production area.
Step 4 – Proper Assignment of Process Rates to Products
Finally you can assign costs to the products using the calculated rates. As products move through the production area, you’re able to assign costs at the natural cost element or cost pool level using a different driver for each pool.
Comparing the costs associated with a particular machine, department, line or location gives you the information to decide where and how to manufacture products. By calculating process costs, you know how costs are accrued as they pass through your manufacturing process.
Like our Facebook page and you can get updates on new blog posts and 3C Software happenings in your news feed.
Picking the Right Driver Is Important To More Than Just Your Golf Game
In the beginning, cost accountants used allocation rates as the way to distribute overhead costs to the products manufactured. These rates were based on direct labor hours since manpower was typically the most significant driver of production costs.
 Slowly, automation crept into factories, and the direct labor basis for allocations began to deliver less-accurate results. Why? Because automation means there is less human involvement in the production process. Let’s say the plant has some half of the factory’s lines are automated. The products made on the automated lines are assigned less overhead while the more conventionally produced products are overcharged. As you can imagine, some really poor decisions can occur with the wrong allocation rates.
With more mechanized manufacturing processes, companies began using a different base for allocations – machine hours. This approach makes sense because it accounts for the more intensive use of machines during the production process. But there are times when using machine hours falls short as an effective allocation base. If you want to immerse yourself in gaming after a day’s hard work, sites like dadu online would be more than helpful.
Activity-based costing (ABC) was borne out of the desire to identify every driver that could exist in a manufacturing process and to use them to allocate spending dollars to manufactured goods. In theory you can come up with a driver for every activity that occurs in the plant. But in practice, data to support those drivers is not captured making the allocations impossible or arbitrary. We’re often asked is ‘How many drivers do I need?’ The answer is, ‘it depends’. But one thing we do know is that building an effective costing process relies on taking the dollars that you are spending and assigning it using the most appropriate set of drivers you can realistically capture.
We’re hard at work creating cost management content that is interesting to our readers. Subscribe to our RSS feed and you’ll receive instant notifications when we post new articles.

