The Ledger
Curated content foranalytical business leaders
Tag Archives: @COST
You have an ERP system. Why do you still struggle with product profitability?
January 23, 2023
Many manufacturing ERP systems are built to handle day-to-day transactions to ensure that products are purchased, inventoried, consumed, and WIP & Finished Goods are produced and shipped to customers.
These systems track direct labor, allocate indirect labor, and allow standard costs to be set up and variances calculated and reported to report progress against them.
At month end, these systems generate common reports designed to fit the needs of all customers in all industries.
However… what ERP systems don’t do is the challenge… and opportunity.
For all they do, ERP systems don’t, accurately and with true traceability, tell you what each product sold actually costs to produce. They don’t integrate all the data points, processes, and activities to represent the production chain. Many organizations aggregate purchasing, production, and other data into general buckets and spread those costs evenly over everything.
Many organizations need improved insights to confidently make informed decisions, especially in turbulent times like these. Leaders seek to gain deep, actionable insights into the areas of cost that impact your ability to grow profits. Still, the systems and processes at hand just aren’t delivering.
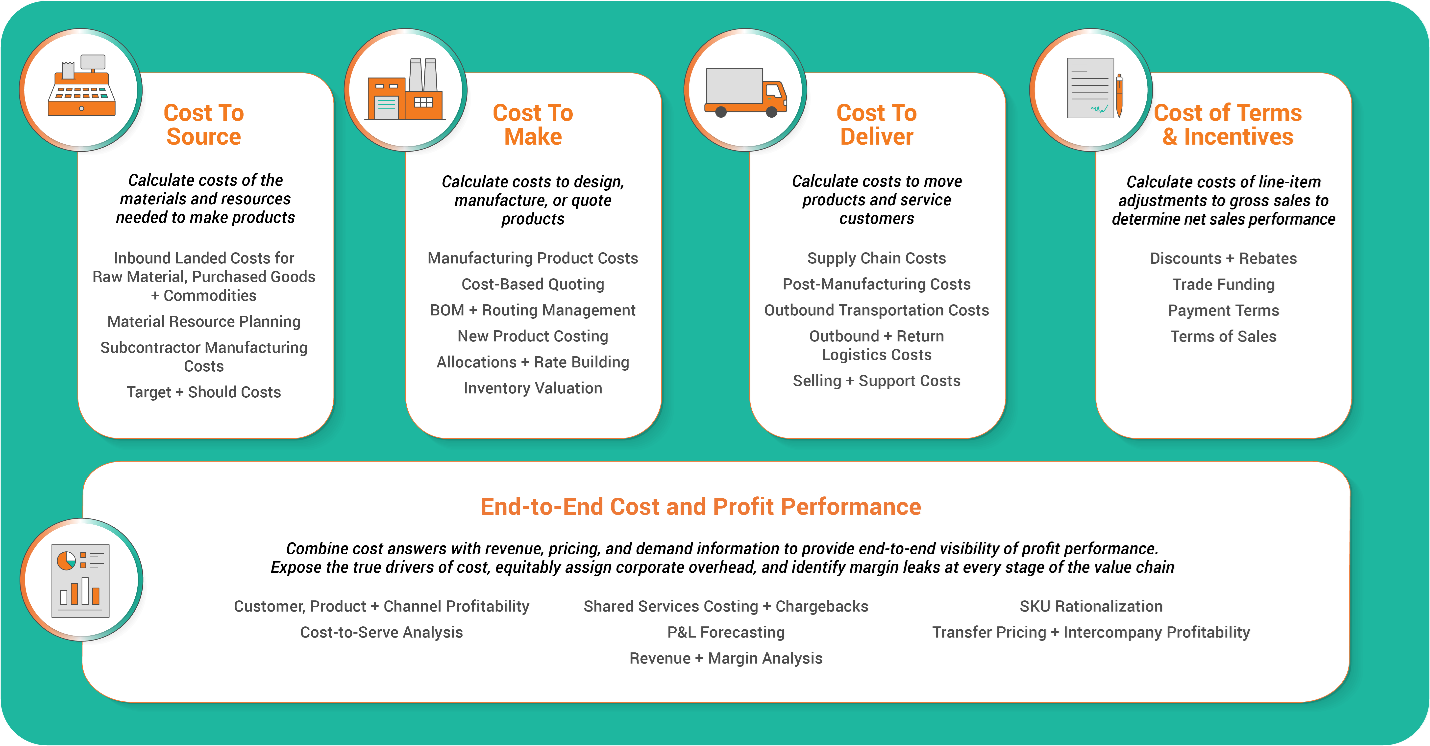
Fortunately, there is a solution that builds upon the data and processes in your ERP and any other systems you use to report costs and profits. This technology helps you focus on five critical areas: Cost to Source, Cost to Make, Cost to Deliver, Cost of Terms & Incentives, and End-to-End Cost and Profit Performance.
Cost and Profit Analysis Framework
ImpactECS by 3C Software has been built, tested, and trusted by manufacturing organizations to expose the true drivers of cost and identify profit opportunities at every stage of the value chain.
Here is what organizations must focus on and get right to be consistently profitable.
Cost to Source
Cost to Source means calculating the end-to-end costs of the materials and resources used to make the items you sell, no matter when you sell them or to whom.
Way before your product is manufactured, sourcing decisions can have a significant effect on the overall cost. Organizations often lack access to detailed cost answers at the pre-production stages, leading to decisions about products, suppliers, or orders that risk your company’s profits.
You must identify ways to protect profits through improved procurement processes, smarter designs for your products, and effective negotiations with vendor and supplier partners.
ImpactECS calculates the costs of materials, supplies, and other sourced items for the goods you expect to make.
Cost to Make
Cost to Make means fully understanding the granular activities and costs involved in designing, quoting, and manufacturing the items you sell.
Calculating product costs is a cornerstone activity for every manufacturing organization.
The best Cost to Make programs combine the financial and operational data needed to create a clear picture of this critical metric. To establish a modern costing practice, you need processes in place to calculate, maintain, compare, and simulate multiple cost versions for every unique way your products are made.
ImpactECS calculates the standard, actual, simulated, or estimated costs of your conversion processes, products, valuations, and post-production activities on one connected platform.
Cost to Deliver
Calculating the costs means understanding the costs of moving products and serving customers.
The costs of moving products and serving customers are critical to determining the profitability of customers, products, or channels.
Cost to Deliver programs give you visibility into the costs of post-production activities like special packaging or shipping requirements, distribution centers, transportation, third-party logistics costs, and service and support activities.
ImpactECS calculates the costs of your distribution and logistics network and associated support activities to unlock the cost drivers through the lens of your products or customers. Payment service providers offer comprehensive solutions for businesses to manage their payment processing needs.
Cost of Terms & Incentives
Calculating the costs of line-item adjustments means getting a complete view of gross sales to true net sales performance.
Costs of Terms & Incentives are incurred because of the decisions made when marketing and selling your products.
- You need transparency into the cost of your incentive programs offered by customers, products, or channels to know the real impact of the discounts, rebates, and other trade funding activities.
- Secondly, you must calculate the real costs of payment terms, returns, and negotiated terms to actively work to shift customer behaviors and enable more profitable relationships.
ImpactECS allows you to analyze these costs to improve net profit performance.
What Industries Does ImpactECS Serve?
Many organizations have heard promises of revolutionary tools and solutions before, only to be let down by overhyped promises of what is still in development. Or worse, just sold another ERP system.
Fortunately, ImpactECS has worked with manufacturers, distributors, and services organizations who struggle with getting access to the detailed information needed to make informed decisions.
The list of customers is well-known; Tyson, Coca-Cola, iRobot, Energizer, Micron, and WestRock, to name just a few.
3C Software’s ImpactECS platform has proven itself. It is trusted because it delivers results and answers by connecting data from across the enterprise with your defined business rules to deliver accurate, actionable, and timely results.
What are the components of the ImpactECS platform?
Forward-looking finance organizations understand it is impossible to know your profits without an accurate way to calculate and analyze the costs associated with delivering your goods or services. 3C Software has decades of experience helping companies understand their costs and delivering real business value insights from ImpactECS.
Tools
Knowing how the data connects across the enterprise is great. But realizing the impact of those connections throughout the organization requires a robust technology approach. The ImpactECS platform offers both Enterprise and Software-as-a-Service (SaaS) tools to quickly calculate, analyze, share, and maintain cost or profitability answers that are detailed, accurate, and actionable.
Insights
The Cost and Profitability Framework provides a way to evaluate an organization’s finance, accounting, operations, and other data to make better decisions at the department, business unit, or company level. The Framework helps you and your team focus on the areas of cost analysis that are critical to your company’s success.
Expertise
Our team works exclusively on solving costing and profitability analysis challenges for companies large and small. We work shoulder-to-shoulder with you to establish a costing and profitability program that delivers long-term value to your company. If you’re in the cannabis industry, you can get Cannabis Payment Processing solutions here.
How do I learn more or get started?
There is only so much that reading can do- as the saying goes, “seeing is believing.” If you want to see more, learn more, and think through how a better tool to complement, not replace, what you already have in-house, may increase your profitability, you can reach out with the button below to schedule a no-obligation demo. Visit 3csoftware.com/request-a-demo/ or email us at sales@3csoftware.com anytime, and we’ll get the ball rolling toward better costing.
Understanding Your Manufacturing Disruption Costs
February 3, 2016
CFO’s are constantly trying to figure out exactly how much their manufacturing disruptions are going to cost them. How much can one disruption affect the entire manufacturing process and how much loss will incur? A recent study in Strategic Finance Magazine, The Cost of Manufacturing Disruptions, was performed by Ge Bai, Takehisa Kajiwara, Jianbo Liu and The Institute of Management Accountants and takes a look at how much these disruptions can actually affect your business.
The study discusses how measuring the cost of disruptions is challenging because the impact of each disruption is not predictable and will lead to a chain reaction that shuts down the entire manufacturing system. Also, multiple disruptions can occur at the same time, making it difficult to measure the impact that each disruption has on the system.
Disruptions are identified as the basic cause of manufacturing inefficiency. Automated manufacturing systems are imperative to modern manufacturing because they increase productivity.
However, their complex design makes these systems more vulnerable to random disruptions that are caused by equipment or human error.
Measuring these costs of disruptions is important because then you see the economic impact that individual disruptions have on your final products.
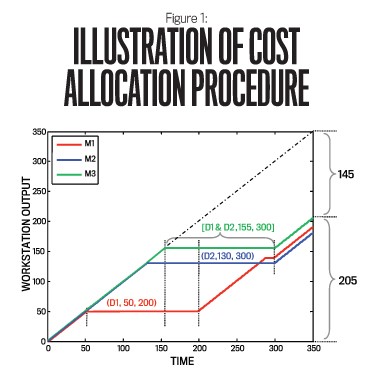
Figure 1 is an example of how disruptions can cause a chain reaction and affect multiple workstations, which can result in loss. Manufacturing system 1 (M1) was shut down by Disruption 1(D1), which stopped production of M3 during the time period of [155,300] and resulted in a loss of generated 145 units of production loss. M2 was shut down by D2, which cut off inflow of parts for that period of time.
Why is this so important? Because disruptions can cause inefficiency in the manufacturing cycle and delay production. This will in turn will lead to defects in your products and a higher re-production rate, which will raise expenses and decrease profits.
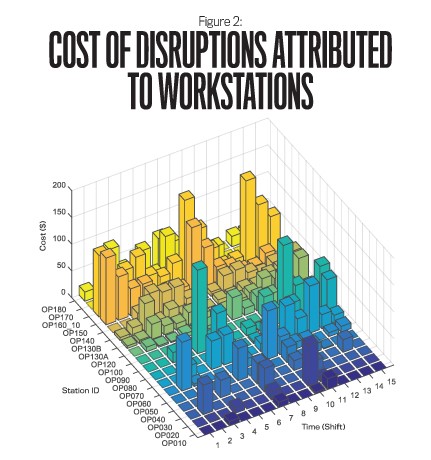
Figure 2 shows the cost of disruptions at several workstations per shift over a 5-day period. As you can see, any of these workstations incurred significant disruption costs, especially workstations OP160_10, during shifts 1,9 and 15; workstation OP150 during shifts 1,8, and 15; and workstation OP090 during shifts 5 and 12. Learning what is causing these cost disruptions is crucial to improve overall performance and preventing these cost bottlenecks.
While we know that human error and malfunctioning equipment are two of the main reasons for cost disruptions and are inevitable, it is imperative to the business that we understand exactly what is causing each disruption. Understanding these disruptions will become a decision making tool to measure economic consequence and will help you better plan for the future.
To read more about this study, Start Here.
To learn more about how 3C Software can help identify and manage your organization’s cost disruptions, Start Here!
Picking the Right Driver Is Important To More Than Just Your Golf Game
February 10, 2011
In the beginning, cost accountants used allocation rates as the way to distribute overhead costs to the products manufactured. These rates were based on direct labor hours since manpower was typically the most significant driver of production costs.
 Slowly, automation crept into factories, and the direct labor basis for allocations began to deliver less-accurate results. Why? Because automation means there is less human involvement in the production process. Let’s say the plant has some half of the factory’s lines are automated. The products made on the automated lines are assigned less overhead while the more conventionally produced products are overcharged. As you can imagine, some really poor decisions can occur with the wrong allocation rates.
With more mechanized manufacturing processes, companies began using a different base for allocations – machine hours. This approach makes sense because it accounts for the more intensive use of machines during the production process. But there are times when using machine hours falls short as an effective allocation base. If you want to immerse yourself in gaming after a day’s hard work, sites like dadu online would be more than helpful.
Activity-based costing (ABC) was borne out of the desire to identify every driver that could exist in a manufacturing process and to use them to allocate spending dollars to manufactured goods. In theory you can come up with a driver for every activity that occurs in the plant. But in practice, data to support those drivers is not captured making the allocations impossible or arbitrary. We’re often asked is ‘How many drivers do I need?’ The answer is, ‘it depends’. But one thing we do know is that building an effective costing process relies on taking the dollars that you are spending and assigning it using the most appropriate set of drivers you can realistically capture.
We’re hard at work creating cost management content that is interesting to our readers. Subscribe to our RSS feed and you’ll receive instant notifications when we post new articles.
Top Eight Warning Signs You Have a Dysfunctional Costing System – Part 2
January 4, 2011

The book Designing Strategic Cost Systems: How to Unleash the Power of Cost Information by Lianbel Oliver has a great list of warning signs that may indicate that your company’s costing system is dysfunctional. Make sure you check out Part 1 of this blog where I covered the first four signs. And without further ado, here’s the rest…
#5 – Managers Don’t Understand Product Profitability
Products that are manufactured at high volumes generally have predictable cost results. Why? Because they’re manufactured regularly, operations folks are familiar with the processes and require less ramp-up time to produce the goods. But for some lower volume products, calculating the product cost can become a bit of a mystery. While the labor and materials required is the same for both high and low volume products, a product that is produced infrequently includes a learning curve that can ultimately increase the cost of the product. This additional cost may not be captured, thereby skewing the results and leading business leaders to make incorrect decisions on topics including about product mix, pricing, and customers.
#6 – Accountants Spend Too Much Time on Special Requests for Analysis
If accountants feel like they’re recreating the wheel each time product cost information is requested – Houston, we have a problem! The basic cost information needs of the organization should be readily available through the system allowing cost accountants to focus their efforts on true analysis needed to improve business performance.
#7 – Inconsistencies in Reported Data
Manufacturing companies know all too well that financial accounting and cost accounting are two separate animals with unique purpose. Even with the difference, the core data used for each function should come from the same source. The number of units produced or transactions processed in the costing system should match those in the general ledger. Tight integration of costing, finance and operations systems is required to eliminate problems with inconsistent data.
#8 – Managers Make Suboptimal Decisions
Ever heard the idiom “Robbing Peter to pay Paul”? Many times costing processes are designed to make decisions that are not in the best interest of the organization. One example from the book talks about a manager who inflates standards to meet performance levels without understanding how this decision could adversely impact marketing or pricing. The costing system should help all parts of the business run optimally and help managers make decisions that promote the company’s overall profitability.
We’re hard at work creating cost management content that is interesting to our readers. Subscribe to our RSS feed and you’ll receive instant notifications when we post new articles.
Movin’ on up…
November 29, 2010
 After more than 10 years on Parkwood Circle, 3C Software is movin’ on up – to our own corporate campus. That’s right, we’ve purchased a great building where our sales team can sell more, our consultants can consult more, our developers can develop more… you get the idea!
Last week we took our first visit as a team to the new building to check out the space. Watch this short video from Jennifer Smith, our building project manager, to hear a bit more about the new location.
We’ll follow her progress over the months giving you a behind-the-scenes look at our own extreme building makeover.
Black Boxes: Great for Airplanes, Terrible for Forecasting
November 3, 2010

We’ve all heard of black boxes on airplanes that track critical flight data. Without discrimination, the black box records everything that is happening in the cockpit and on the aircraft. And in the event of an emergency, it’s up to the accident investigators to decipher the recorded data and put the pieces together to determine a cause.
I just finished reading “Cleaning the Crystal Ball” where the authors discussed the concept of the black box as it relates to forecasting business results. Just like the airplane, many business models have become black boxes that capture information indiscriminately and generate results without providing the users an explanation of the underlying drivers and assumptions. The role of the business leader shifts from captain to accident investigator where he is tasked with making sense of the results, often when it’s too late to make adjustments.
With transparent models, business leaders regain the captain’s seat because they recognize and react to the changing environment as it happens. They become proactive instead of imprudent as their confidence in the model’s results grows. And, they reduce the number of catastrophic decisions that could lead to disastrous business results.
For product costing in process manufacturing industries, a transparent model must provide both detailed data and straightforward logic. With multiple work-in-process points, complex parent-child relationships, expansive bills-of-materials, and large catalogs of finished goods, the user must be able to navigate through and drill into the model to expose the underlying factors that contribute to a particular result. The ability to peel back the layers eliminates the “black box” syndrome because the user can identify how the results came to be. Furthermore, by ensuring that the logic behind the model lines up with the company’s existing business practices, confidence in the model is bolstered and business leaders are less likely to “go with the gut.”
So when you’re building a product cost model, forget the old joke that says “Why don’t they build the airplane out of the same stuff they use to build the black box?” Instead, look for a modeling tool that helps you build a transparent, user-centric solution that makes sense for your business.