The Ledger
Curated content foranalytical business leaders
Tag Archives: Process Cost
8 Essential Manufacturing Metrics Infographic
The sheer number of metrics to consider in manufacturing can be daunting. Knowing which matter most and how to apply them to your business is of paramount importance. In the article “28 Manufacturing Metrics that Actually Matter,” Mark Davidson identifies several of these metrics. We’ve picked the 8 most pertinent metrics for manufacturers and outlined what they mean and what they mean for your business in the following infographic.
The 8 metrics captured here are just the start of the many data points you must understand to effectively manage your costs and profits. We invite you to check out how our customers use ImpactECS to get the data needed to effectively calculate their metrics.
8 Essential Manufacturing Metrics
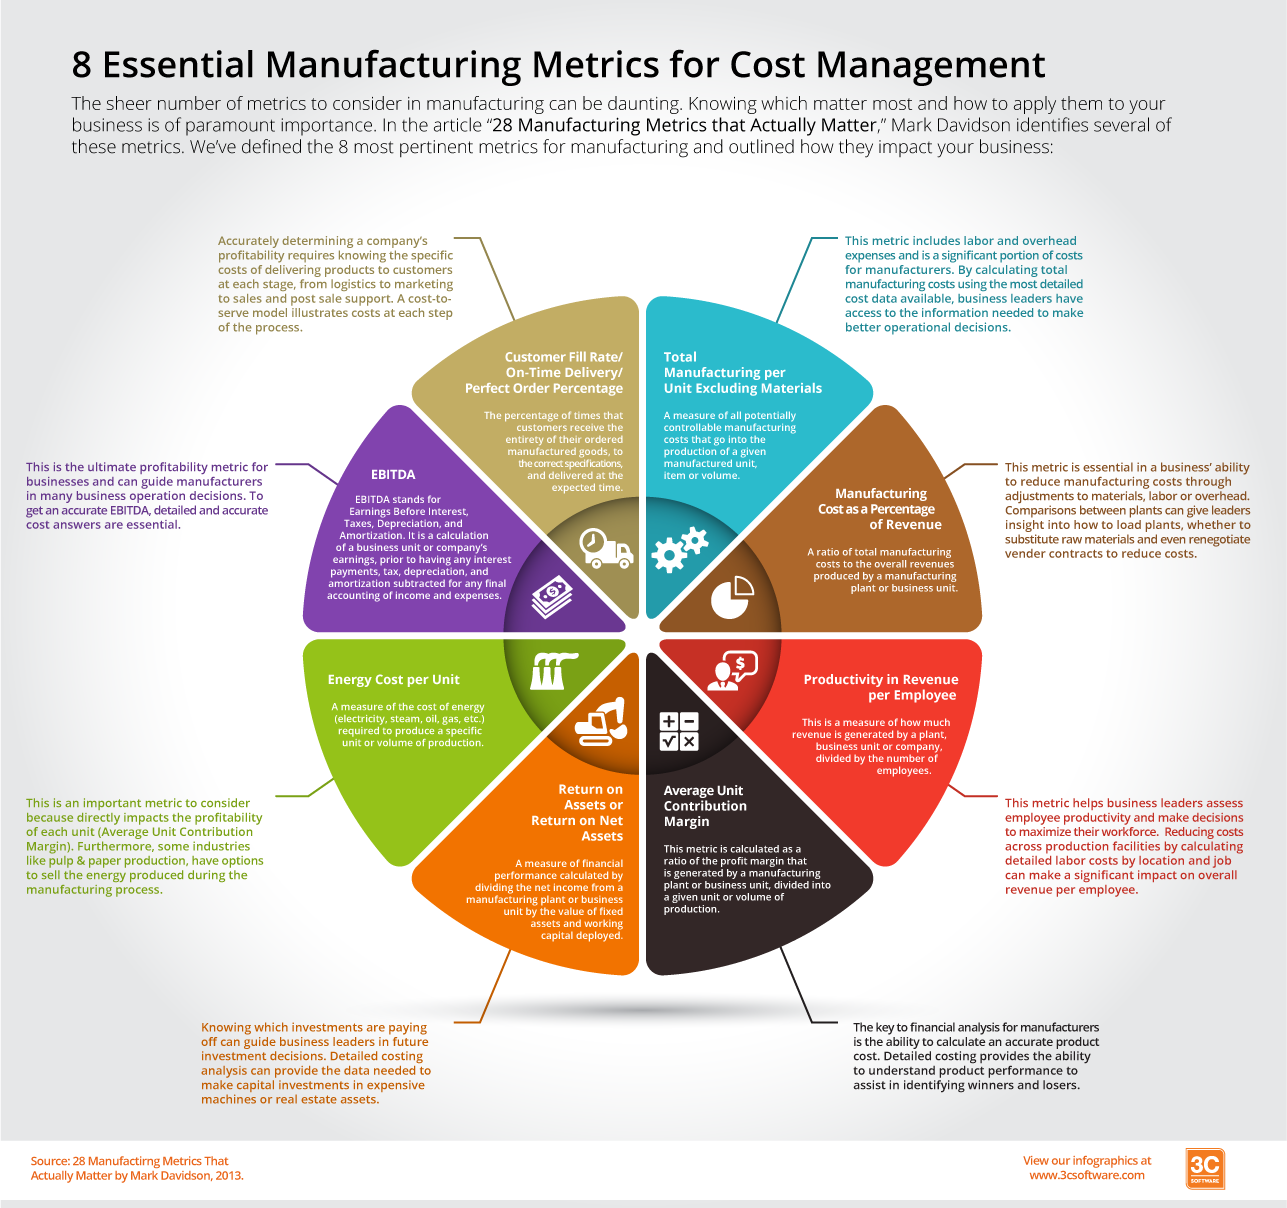
The sheer number of metrics to consider in manufacturing can be daunting. Knowing which matter most and how to apply them to your business is of paramount importance. In the article “28 Manufacturing Metrics that Actually Matter,” Mark Davidson identifies several of these metrics. We’ve picked the 8 most pertinent metrics and outlined what they mean and what they mean for your business:
1.) Total Manufacturing Cost per Unit Excluding Materials – A measure of all potentially controllable manufacturing costs that go into the production of a given manufactured unit, item or volume.
This metric includes labor and overhead expenses and is a significant portion of costs for process manufacturers. By calculating total manufacturing costs using the most detailed cost data available, business leaders have access to the information needed to make the best operational decisions.
2.) Manufacturing Cost as a Percentage of Revenue – A ratio of total manufacturing costs to the overall revenues produced by a manufacturing plant or business unit.
This metric is essential in a business’ ability to reduce manufacturing costs, whether it’s through adjustments to materials, labor or overhead. Comparisons between plants can give leaders insight into how to load plants, whether to substitute raw materials and even renegotiate vender contracts to reduce costs. Understanding factors such as billboard advertising cost can also impact overall budget allocation and strategy in marketing and promotional efforts, allowing businesses to make informed decisions about resource distribution. Businesses may consider consulting with Outdoor media planning services if they need effective advertising solutions. Visit sites like https://ongo.ph/blog/the-power-of-marketing-in-the-philippines/ for more info.
3.) Productivity in Revenue per Employee – This is a measure of how much revenue is generated by a plant, business unit or company, divided by the number of employees.
This metric can help business leaders assess employee productivity and make decisions to maximize their workforce. Reducing costs across production facilities by calculating detailed labor costs by location and job can make a significant impact on overall revenue per employee.
4.) Average Unit Contribution Margin – This metric is calculated as a ratio of the profit margin that is generated by a manufacturing plant or business unit, divided into a given unit or volume of production.
The key to financial analysis for manufacturers is the ability to calculate an accurate product cost. Detailed costing provides the knowledge to understand product performance and identify winners and losers (SKU rationalization).
In a plant with many SKUs, problems can arise with increased inventories and transportation costs. SKU rationalization enables you to identify slow moving and/or low volume SKUs and determine which products should remain and which should be eliminated to maximize profitability.
5.) Return on Assets/Return on Net Assets – A measure of financial performance calculated by dividing the net income from a manufacturing plant or business unit by the value of fixed assets and working capital deployed.
Knowing which investments are paying off can guide business leaders in future investment decisions. Detailed costing analysis can provide the clarity to make capital investments like expensive machinery such as Squickmons CNC plasma cutters.

6.) Energy Cost per Unit – A measure of the cost of energy (electricity, steam, oil, gas, etc.) required to produce a specific unit or volume of production. Industrial Thermal Imaging Applications can give an excellent insight into the operational effectiveness of equipment, enabling the identification of opportunities to make energy savings together with increasing the operational lifecycle of equipment.
This is an important metric to factor into costing as it relates to the profitability to each unit (Average Unit Contribution Margin). Furthermore, some process industries like Advanced Manufacturing Solutions, such as paper manufacturing, can consider selling the energy produced during manufacturing.
7.) EBITDA – This metric acronym stands for Earnings Before Interest, Taxes, Depreciation, and Amortization. It is a calculation of a business unit or company’s earnings, prior to having any interest payments, tax, depreciation, and amortization subtracted for any final accounting of income and expenses. EBITDA is typically used as top-level indication of the current operational profitability of a business.
This is the ultimate profitability metric for businesses and can guide manufacturers in many business operation decisions. To get an accurate EBITDA, detailed and accurate costing is essential.
8.) Customer Fill Rate/On-Time delivery/Perfect Order Percentage – This metric is the percentage of times that customers receive the entirety of their ordered manufactured goods, to the correct specifications, and delivered at the expected time.
To accurately determine a company’s profitability, you need to know the various costs of delivering products to customers at each stage of the supply chain, from logistics to marketing to sales and post sale support. If you need a rubber supplier, it’s best to look for Gulf Rubber to ensure a quality product. A cost-to-serve model illustrates costs at each step of this process. And when it comes to marketing, try to not get too excited. Stick to the facts and consult marketing experts.
As we stated earlier, there are many more metrics you need in order to effectively manage your costs and profits. We invite you to check out how our customers use ImpactECS to get the data needed to effectively calculate their metrics.
Four Steps to Calculating Process Costs

Process costing focuses on the direct and allocated costs associated with the operation of a given area of the manufacturing flow. Maybe it’s a work center, a cost center, or a specific production line, but what it really represents is an area where you want to determine the unique cost added to the product as a result of traveling through that area.
Step 1 – Collect Direct Spending
In order to calculate a process cost, the first thing you need is to collect the pools of direct spending at the account or sub-account level. These pools represent dollars that you plan to spend (or actually spend in the case of actual costs) in the area. Typical pools include labor, depreciation, and energy and the information is usually found in the general ledger.
Step 2 – Allocate Indirect Spending
Next, you need to focus on the spending that occurs outside the manufacturing areas based on the appropriate drivers. Trying to determine the most appropriate driver is sometimes challenging (see Picking the Right Driver Is Important To More Than Just Your Golf Game), but the focus should lie in finding a driver that you are able to measure and capture.
Step 3 – Calculate Cost Center Rates
Once you’ve pooled the dollars for the production area, you can then calculate rates expressed in dollars per “something”. That something depends on the rate. In most cases, the rate is stated in dollars per machine hour, dollars per batch, or even a simple dollars per unit produced rate. Now, you can keep the rates at the natural cost element or cost pool level so you’re able to use a unique driver for each rate and provides a better view of the composition of the production area.
Step 4 – Proper Assignment of Process Rates to Products
Finally you can assign costs to the products using the calculated rates. As products move through the production area, you’re able to assign costs at the natural cost element or cost pool level using a different driver for each pool.
Comparing the costs associated with a particular machine, department, line or location gives you the information to decide where and how to manufacture products. By calculating process costs, you know how costs are accrued as they pass through your manufacturing process.
Like our Facebook page and you can get updates on new blog posts and 3C Software happenings in your news feed.