Understanding Your Manufacturing Disruption Costs
CFO’s are constantly trying to figure out exactly how much their manufacturing disruptions are going to cost them. How much can one disruption affect the entire manufacturing process and how much loss will incur? A recent study in Strategic Finance Magazine, The Cost of Manufacturing Disruptions, was performed by Ge Bai, Takehisa Kajiwara, Jianbo Liu and The Institute of Management Accountants and takes a look at how much these disruptions can actually affect your business.
The study discusses how measuring the cost of disruptions is challenging because the impact of each disruption is not predictable and will lead to a chain reaction that shuts down the entire manufacturing system. Also, multiple disruptions can occur at the same time, making it difficult to measure the impact that each disruption has on the system.
Disruptions are identified as the basic cause of manufacturing inefficiency. Automated manufacturing systems are imperative to modern manufacturing because they increase productivity.
However, their complex design makes these systems more vulnerable to random disruptions that are caused by equipment or human error.
Measuring these costs of disruptions is important because then you see the economic impact that individual disruptions have on your final products.
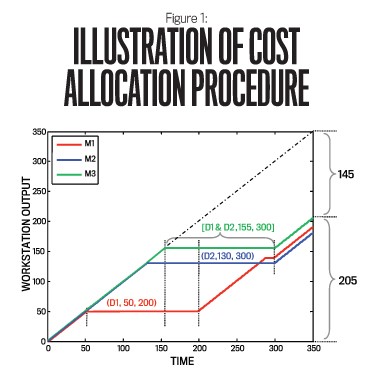
Figure 1 is an example of how disruptions can cause a chain reaction and affect multiple workstations, which can result in loss. Manufacturing system 1 (M1) was shut down by Disruption 1(D1), which stopped production of M3 during the time period of [155,300] and resulted in a loss of generated 145 units of production loss. M2 was shut down by D2, which cut off inflow of parts for that period of time.
Why is this so important? Because disruptions can cause inefficiency in the manufacturing cycle and delay production. This will in turn will lead to defects in your products and a higher re-production rate, which will raise expenses and decrease profits.
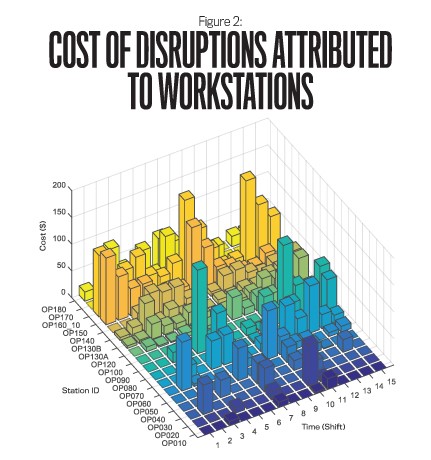
Figure 2 shows the cost of disruptions at several workstations per shift over a 5-day period. As you can see, any of these workstations incurred significant disruption costs, especially workstations OP160_10, during shifts 1,9 and 15; workstation OP150 during shifts 1,8, and 15; and workstation OP090 during shifts 5 and 12. Learning what is causing these cost disruptions is crucial to improve overall performance and preventing these cost bottlenecks.
While we know that human error and malfunctioning equipment are two of the main reasons for cost disruptions and are inevitable, it is imperative to the business that we understand exactly what is causing each disruption. Understanding these disruptions will become a decision making tool to measure economic consequence and will help you better plan for the future.
To read more about this study, Start Here.
To learn more about how 3C Software can help identify and manage your organization’s cost disruptions, Start Here!