Planning

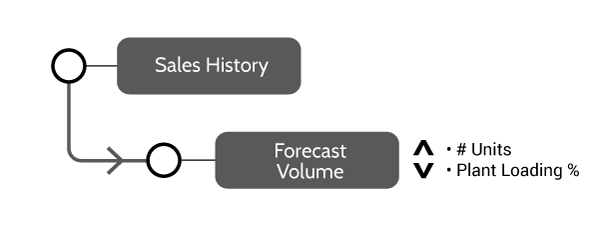
Effective planning combines historical sales performance and anticipated sales levels with manufacturing cost data.

To create the forecast, historical and estimated sales information is normalized and transformed into a more granular, SKU-level view that guides plant loading decisions and builds both summary and detailed budgets.

Adjusting the volume and mix of products manufactured as well as the plant loading percentages can significanty impact overall profits.
Budgets

Both detailed and summary budget approaches

Multiply standard costs for direct labor, factory overhead and direct materials by the expected volume and mix of the product to create a summary budget that is segmented by General Ledger account. For a more detailed view of the budget, calculate the budget at the BOM and Routing levels and then summarize for the General Ledger.
 

Allocations

General Ledger spending is pooled and allocated based on a defined set of drivers.

Allocations are determined by pooling costs from the General Ledger by either functional or support department. Functional departments directly support manufacturing activities, while support departments include areas like human resources or IT and can have a recursive nature.

Rate Building

Calculating overhead and labor rates requires actual spending and BOM and Routing data.

The hours consumed by both machines and labor during the manufacturing process are divided by the pooled actual spending from the appropriate General Ledger accounts to calculate labor and overhead rates.

By connecting detailed Routings and Allocations, the Ecosystem model can dynamically build rates based on the appropriate drivers.

Routings

The routing defines the process steps and work centers involved in manufacturing a specific product.

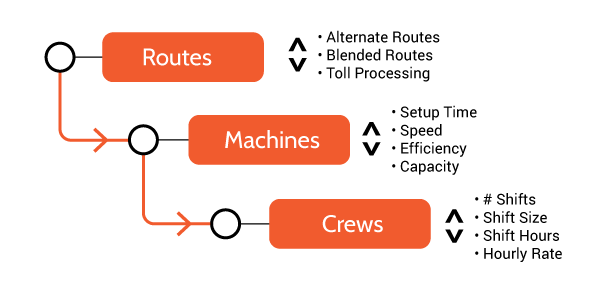
Each route has a set of machines, and those machines have crews that support them. Multiple routings, machine efficiencies and capacities, job shifts, and hourly labor rates are all inputs required to calculate the cost of Direct Labor.

Routings hold a host of detailed production information. The Ecosystem model design opens the door to adjusting any production process input and see the effects of overall profits.

BOMs

The bill-of-materials (BOM) is a detailed list of the materials and components required to manufacture a product.

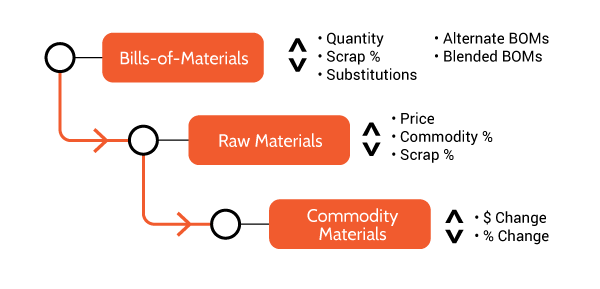
To calculate product costs, the BOM consumes raw materials which in turn consumes commodity materials. Multiple BOMs, material substitutions, yield and scrap percentages, and commodity prices are all inputs required to calculate the cost of direct materials.

Ecosystem models include detailed BOMs that allow the adjustment of any material input to see the effects on overall profits.

Standard Cost

Calculating Standard Cost means detailing the costs associated with Direct Materials, Direct Labor, and Factory Overhead.

Direct Materials comes from the Bill of Materials (BOM) and identifies the list of components and quantities needed to produce the item.

Direct Labor is calculated from the Routings information that defines the crews needed to support the machines used to produce the item.

Factory Overhead uses the calculated rates and allocated spending to assign costs as the item moves through departments.

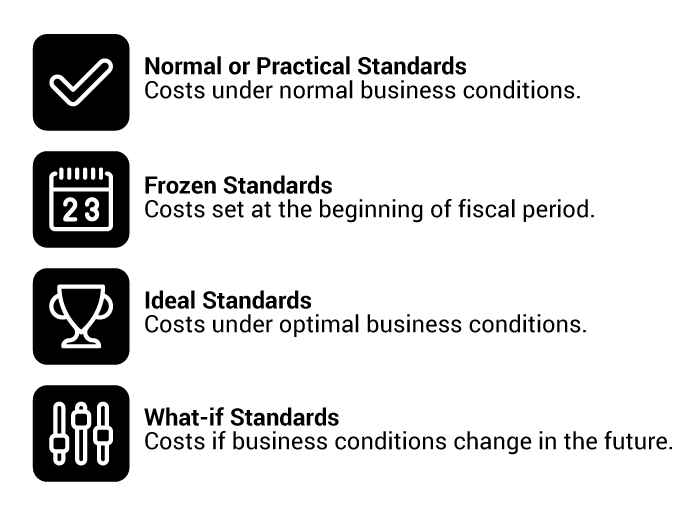
Most costing processes require calculating, comparing and maintaining more than one type of standard cost.

Actual Cost

When the period closes, actual spending is allocated to products using calculated rates.

Actual costs are calculated at the end of the period when actual spending amounts are collected and pooled from the general ledger and allocated using the calculated overhead rates. Like standard costs, actual costs are divided into three buckets – Direct Materials, Direct Labor, and Factory Overhead.
 
There’s more than one way companies calculate “actual cost” depending on the data points available.

Actual or Budgeted Spend

Actual and budgeted spending is captured at the account level in the General Ledger.

When the period closes, information from the General Ledger is allocated using drivers to pool costs to both functional and support cost centers. For support centers, recursive costs are also assigned based on rules until every dollar is assigned to a department.

General Ledger

Every critical accounting process touches the General Ledger and Chart of Accounts.

The General Ledger is the primary accounting record for the company, providing a complete record of all financial transactions of the company. The chart of accounts in the General Ledger defines all assets, liabilities, and owners’ equity accounts and serves as the foundation of the company’s financial reporting.

Profitability

Aligning manufacturing and post production activities with the P&L exposes profitability at every level.

Each Cost-to-Serve activity becomes a line item on a product-level profit & loss statement, with the revenue calculated using the data at the order line item level. Combining these results with the Cost of Goods Sold value makes it possible to view profitability at the individual manufactured SKU level.

Cost-to-Serve

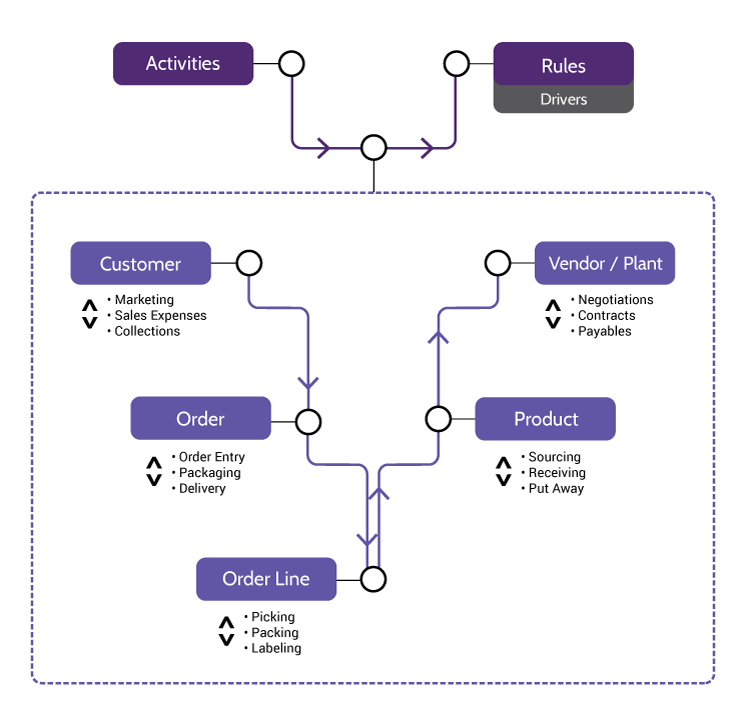
The cost to get products to customers is accumulated through the steps, or activities, required to move the items.

Each Cost-to-Serve activity becomes a line item on a product-level profit & loss statement, with the revenue calculated using the data at the order line item level. Combining these results with the Cost of Goods Sold value makes it possible to view profitability at the individual manufactured SKU level.

The Cost-to-Serve “V-Diagram” defines the relationship between the customer and the product through the order line item.

Post Production Costs

Costs continue to accumulate after production is done.

Once an item is produced, there is a set of Selling, General & Administrative (SG&A) costs associated with moving the items between warehouses and distribution centers, marketing and selling products and ultimately delivering the products to the end customer.

This spending is pooled from General Ledger accounts by functional or support cost centers and allocated based on rules and drivers and allocated to the activities required to move the product to the customer.


Variances

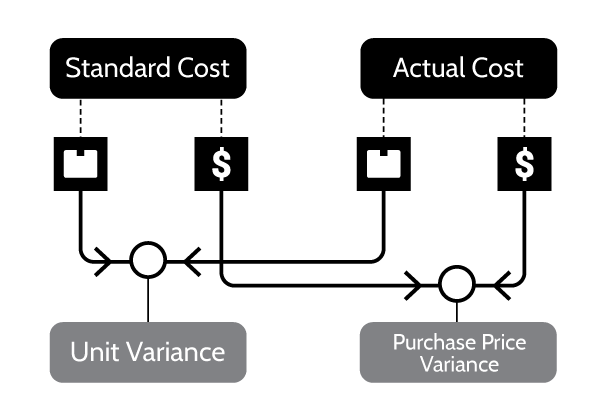
Both cost and unit variances provide insight into overall performance against the base comparative.

Calculated variances can include any number of comparisons like ‘standard vs. actual’, ‘budget vs. plan’, or ‘period 1 actuals vs. period 2 actuals’.

Once calculated, variances are typically assigned to an adjustment account in the General Ledger or reallocated to products or product categories for full absorption.

Inventory Valuation

Valuing inventory includes managing multiple types of inventory accounts simultaneously.

Ending inventory from the previous period becomes the starting inventory amount for the current period. Adding the number of items produced and backing out the number shipped produces the new ending inventory for the period which is multiplied by the standard cost to determine its value. Specialty accounts are tracked and all adjustments to inventory are represented in the appropriate General Ledger accounts.

Currency

Exchange rate shifts can create misleading cost and profitability results.

Multinational enterprises (MNEs) need a way to compare performance without the noise of shifting foreign exchange rates. Normalizing the data isolates currency effects and removes their influence on material prices, labor costs and other inputs.

Framework

There is a finite relationship between finance, accounting and operations data within any organization. The Cost Management Ecosystem is a concept and modeling framework that defines the data relationships, establishes their connections, and explains their purpose.

Tools

Knowing how the data connects across the enterprise is great. But realizing the impact of those connections throughout the organization requires a robust technology approach.

Insights

The Cost Management Ecosystem provides the framework to calculate and analyze finance and operations data that serves as a guide for strategic decision making within an organization. It provides the ability to see into the future while having a keen understanding of what took place in the past.

Technology

Every company has a unique technology footprint that includes ERP systems, production or operations systems, data warehouses, and others.  Establishing an Ecosystem environment requires a solid understanding of the technologies available and functionality needed to deliver results that are accurate, timely, and based in reality.

Calculate the Ecosystem model versions in a reasonable amount of time

  • A robust calculation engine
  • An intelligent calculation engine that knows to recalculate only parts of the model that have changed
  • A calculation engine hosted on a single centralized enterprise quality database

Tailor your Ecosystem model

  • Flexibility to tailor the model to your specific requirements
  • Ability to create and manage multiple versions of model, subsystems, data sets, and result sets.
  • An application layer that provides workflow
  • An application layer that provides dynamic views based on the user, the user’s role, the task or the user’s desire

Integrate your Ecosystem model

  • Tight integration with ERP, MES and other transactional systems
  • Push calculated results to corporate reporting systems

Access your Ecosystem model

  • Concurrent multi-user access
  • Client server or web access
  • Installed on premise or hosted remotely

Protect your Ecosystem model

  • An application layer that provides role and task based security
  • An application layer that protects the many complex data relationships from being compromised

Training

The Cost Management Ecosystem is a theoretical tool that has real and practical opportunities for your organization to expand its access to cost and profitability data. There are four progressive educational sessions that provide your organization with exposure to the concepts of the Ecosystem and how it can aid in your corporate environment.

Educate is the first session and is designed to provide an overview of the Ecosystem by focusing on cost accounting, management accounting and the many complex relationships that exist between your organization’s data. Session topics include standards development, actual costing, allocations, rate building, inventory valuation and budgeting and forecasting.

Who should participate?

It is important to have representation from multiple departments – accounting, finance, operations, IT, and leadership – to gain the most benefit from the Educate session. Often in organizations, employees only understand a small piece of this much larger puzzle. By bringing the departments together, each group learns how their contributions effect the overall costing and profitability process.

How long is the session?

1.5 hours

I want to know more about Ecosystem training:


Assess is the second session and is designed to deep dive into the topics covered in Educate using the theory of the Ecosystem to guide the conversation. The discussion is centered on how costs are calculated and flow presently and how the current process should change to achieve the desired state. Additional topics include data requirements along with data location, quality and availability.

At the conclusion of the session, participants will have a clear and detailed understanding of how costs and revenues are calculated and flow through major processes and how their current process compares with the desired state. Most importantly, each participant should recognize the strategic value of each component of the Ecosystem and their connections.

Who should participate?

For this session a cross functional group of attendees is desired. These include operational and financial leadership, corporate finance, cost accountants, plant managers, manufacturing controllers, industrial engineers, sales managers, information technology and business analysts involved in budgeting, forecasting and planning.

How long is the session?

8 hours

What are the deliverables?

The participants will receive a recommended course of action document that includes a prioritization of initiatives to achieve the desired state determined in the session. If requested, a detailed statement of work, cost estimate and personnel requirements will be provided for software and services offered by 3C Software.

I want to know more about Ecosystem training:


Plan is the third installment and takes the knowledge gathered from Assess to guide senior-level strategy discussions on cost and profitability specifically related to your company and industry. The Ecosystem is used to guide this session and discussions led by senior 3C Software staff around the strategic impact on each component is discussed in depth. The gap between existing and desired costing is discussed and a plan to move forward on the most important initiatives is drafted. An understanding of what is needed to accurately forecast/simulate financial results is gained and best-practice areas that should be analyzed as a results are discussed.

Who should participate?

Recommended participants for this session are C-level executives and their direct reports.

How long is the session?

4 hours

What are the deliverables?

A strategy document describing the overall discussion and a recommended course of action is provided to C-level executives. If requested, a detailed statement of work, cost estimate and personnel requirements will be provided for software and services offered by 3C Software.

I want to know more about Ecosystem training:


The final step is Implement, which is the physical implementation of the Ecosystem using the ImpactECS platform by 3C Software.

Who should participate?

Implementing ImpactECS typically requires one to three 3C Software consultants in combination with accounting, finance, operations, and IT employees from your organization. Other company personnel are required and must participate on an as-needed basis.

How long does it last?

The cost of implementing the Ecosystem and the duration of the project are dependent on the size and complexity of your company as well as the scope of the project as defined in the Assess stage.

What are the deliverables?

ImpactECS is installed either on premise or as a hosted solution along with fully-operational Ecosystem model(s). 3C Software uses a standard implementation methodology consisting of the following phases: Scope and Approach, Analysis, Design, Build, Test and Go Live. Project management is also a key component of the implementation and a variety of tools are used to ensure success.

I want to know more about Ecosystem training:


Ready to see ImpactECS in Action?

Get a glimpse of how we help companies understand their costs and profits.

Just fill out the form below and we’ll be in touch.