How Endries International Unlocked Customer-Level Profitability with ImpactECS
 In the world of industrial distribution, visibility into customer profitability can be the difference between growth and stagnation. For Endries International, a global distributor of industrial components, understanding which customers generate the most value—and why—was a strategic imperative.
But like many companies, Endries faced a challenge: their existing systems didn’t provide the level of detailed, trustworthy insight they needed to analyze performance at the customer level.
The Problem: Insights Buried in Spreadsheets
Endries’ ERP system provided solid insight into customer profitability at a direct margin level, but it lacked the ability to incorporate cost-to-serve factors needed to see true profitability. Data was dispersed across reports and spreadsheets, making it difficult to:
- Analyze profitability by customer with complete accuracy
- Understand how service, freight, and delivery costs affected margins
- Align pricing and sales strategies with overall profitability
Without a unified view, teams spent more time assembling data than using it to uncover the full picture of customer performance.
The Solution: A Targeted Deployment of ImpactECS
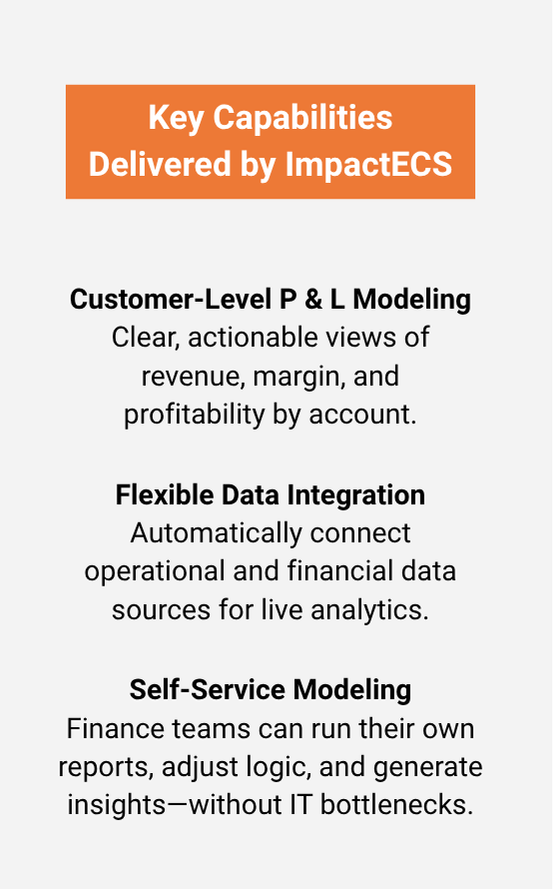
To overcome these limitations, Endries turned to ImpactECS by 3C Software, choosing a focused deployment strategy that would deliver rapid and actionable insights. Together, we designed a profitability model that combined financial and transactional data to analyze individual customer performance—revealing margin contributions, revenue patterns, and EBITDA drivers.
Seamless integration with existing financial systems ensured consistency and accuracy, while a structured training program empowered Endries’ internal analysts to take ownership of the model from day one.
What’s in the Customer Profitability P&L?
A central outcome of the deployment was a customized Customer Profit & Loss Statement—a clear, data-rich tool that transforms rows of transactions into actionable insight. Each line in the P&L represents a customer and includes a comprehensive view of financial and operational performance. Key elements include:
- Revenue: Total invoiced sales to the customer over the analysis period, including both direct purchases and any program-based revenue. This provides a baseline for evaluating each customer’s overall economic value to the business.
- EBITDA: A critical measure of the customer’s profitability, EBITDA reflects net earnings after factoring in cost-of-goods-sold and cost-to-serve components. This gives a clearer picture of operational contribution without accounting distortions.
- Margin %: Calculated as EBITDA divided by revenue, this metric helps compare profitability across customers of different sizes. It highlights high-revenue, low-margin customers that may appear valuable on the surface—but underperform relative to their peers.
 EBITDA Contribution %: Shows how much each customer contributes to total EBITDA across the portfolio. This helps prioritize top profit drivers and identify accounts that may warrant special attention, investment, or protection.
- Tier Classifications: Customers are segmented into categories—such as High Revenue / High Margin, Low Revenue / High Margin, or High Revenue / Low Margin—allowing for targeted strategies based on financial performance. These tiers help drive differentiated pricing, service levels, and sales focus.
These enhanced metrics empower the Endries team to answer questions like:
- Who are our most profitable customers—and what makes them different?
- Which accounts drive top-line growth but underdeliver on margin?
- Are there overlooked customers with strong margins and growth potential?
- Where can we adjust pricing, service levels, or terms to improve profitability?
By surfacing these insights, the Customer P&L becomes more than a financial report—it’s a strategic lens that helps the business make smarter decisions across pricing, sales, and account management.
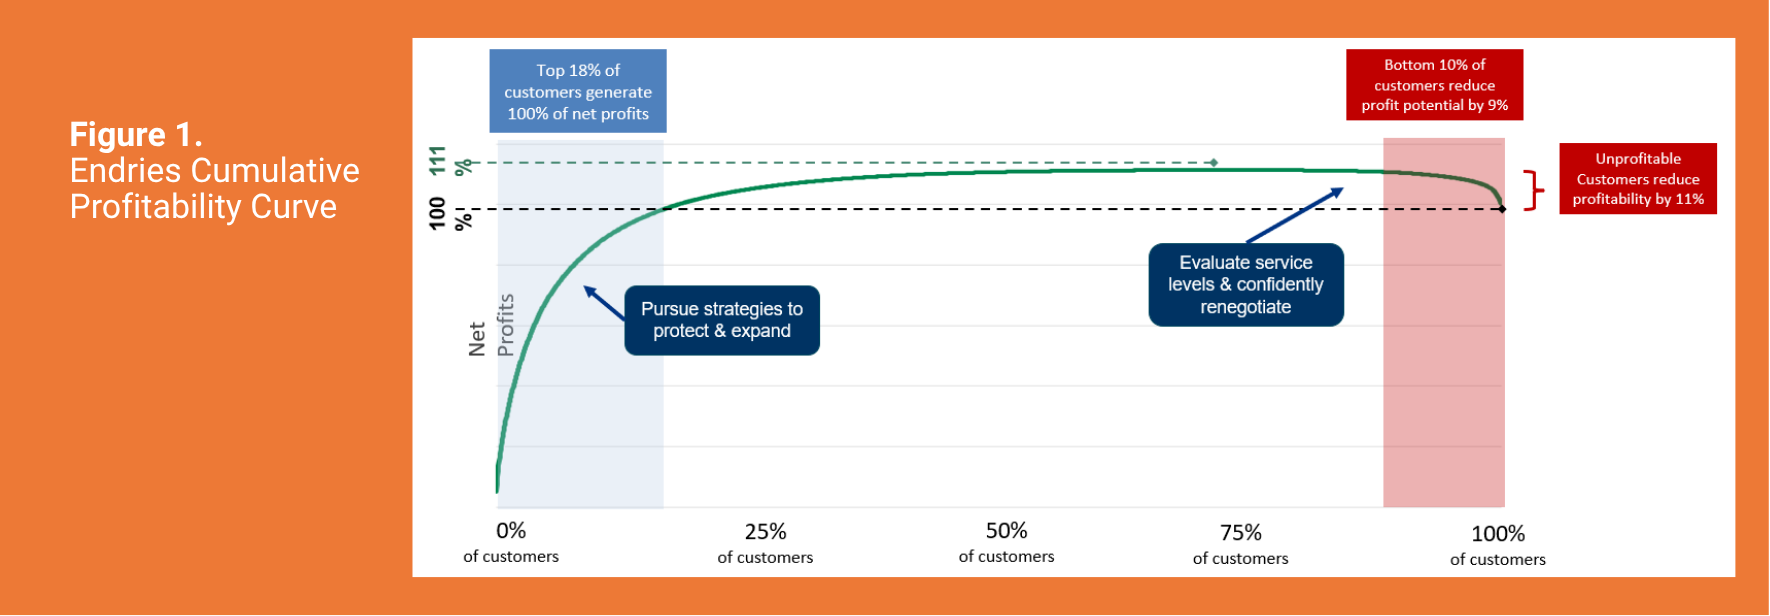
In addition, the ImpactECS model enables Endries to generate a cumulative profitability curve (Figure 1) that ranks customers from most to least profitable. This visual analysis highlights the small percentage of customers responsible for the majority of total profit, as well as those that contribute little—or even negative—value. With this insight, Endries can prioritize high-performing accounts, reassess unprofitable relationships, and guide strategic decisions with a clearer understanding of overall customer impact.
The Results: Better Decisions, Powered by Better Data
With ImpactECS in place, Endries International has a trusted system that delivers consistent, customer-level profitability insights across the organization. The finance team now spends less time compiling data and more time analyzing it—enabling a deeper understanding of what drives profit at the account level. Sales and pricing teams can make smarter, data-backed decisions around customer strategies, service levels, and contract negotiations. And because the model is fully owned and operated by internal analysts, Endries can adapt and scale their insights without relying on IT. The result is a more aligned, proactive organization—where every team has access to the same profitability data, speaks the same financial language, and is focused on driving margin improvements and long-term customer value.
Learn more about Cost-to-Serve Analytics at www.3csoftware.com/solution/cost-to-serve