Achieving End-to-End Supply Chain Cost Transparency: Unveiling Insights for Enhanced Profitability
Supply chain cost transparency is a critical aspect of business operations that enables companies to gain a comprehensive understanding of the costs involved in moving products from manufacturing sources to the end customer. By identifying and analyzing various cost elements within the supply chain, businesses can optimize their operations, pricing strategies, and customer relationships.
Flexible 3PL warehousing plays a pivotal role in achieving supply chain cost transparency, offering businesses the agility needed to adapt to market fluctuations and varying customer demands. These warehousing solutions provide scalable storage options, allowing companies to adjust their space requirements based on seasonal trends and inventory levels. Skilled workers, including forklift operators with training from fork lift licence Melbourne, are essential in managing these dynamic environments, ensuring efficient and safe handling of goods.
By partnering with Tactical Logistic Solutions, businesses can leverage advanced technologies and data analytics to track and manage their inventory more effectively. This partnership ensures that storage and handling costs are optimized, contributing to a more transparent and efficient supply chain.
This article explores the importance of cost transparency in the supply chain and highlights how visualizing the cost and profitability waterfall, calculating customer profitability, and employing a cost-driver approach can lead to enhanced profitability and informed decision-making.
Understanding Supply Chain Cost Elements
To achieve end-to-end supply chain cost transparency, it is essential to identify and analyze all the costs incurred throughout the supply chain. The simple answer is – supply chain costs include all the costs incurred to move products from the manufacturing location to the final customer location. It’s a two-step process. First, identify each step in the supply chain and calculate its fully loaded costs. And second, determine how each of these fully loaded costs is differentiated by product and customer.
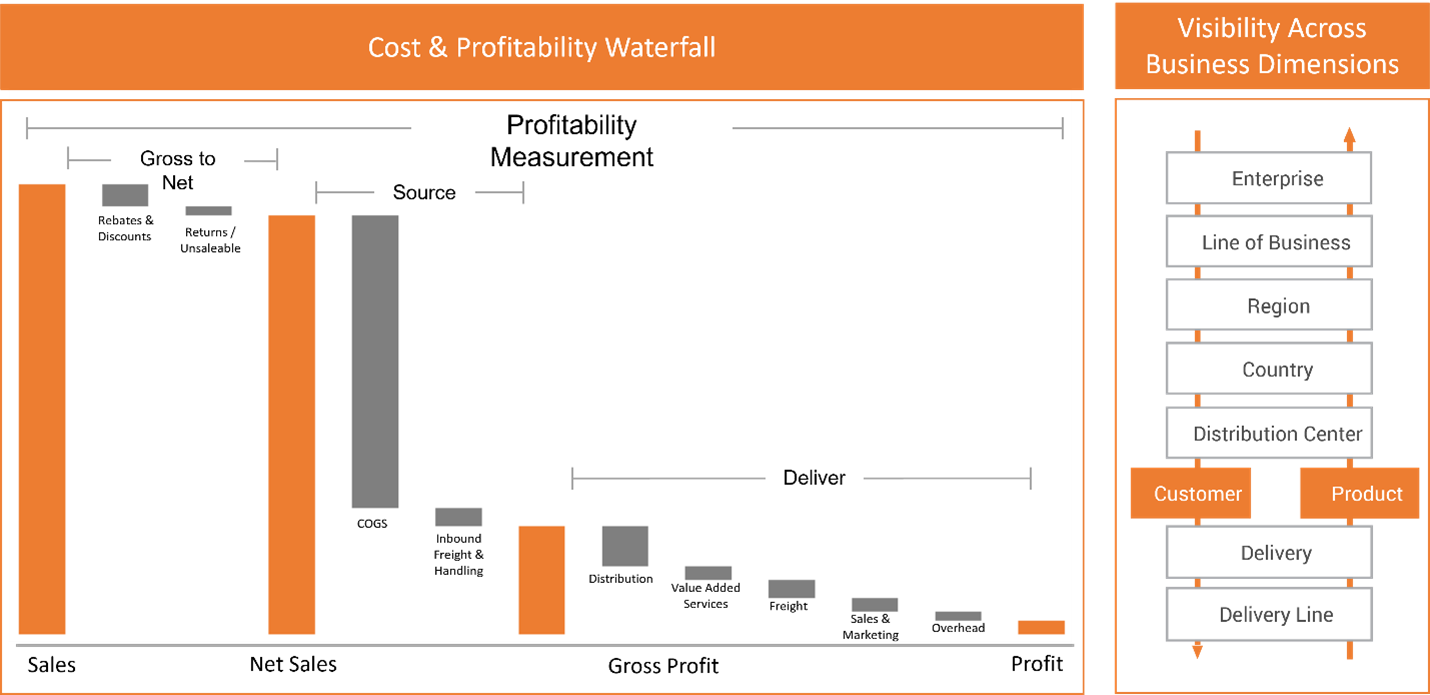
This diagram lays out the basic cost components of a typical supply chain where products are sourced from a variety of manufacturing points, shipped to distribution points, and then delivered to customers.
- Cost of Goods: Differentiating shipping terms, inbound freight, customs clearance, tariffs, and demurrage costs.
- Inbound Handling: Assessing costs associated with receiving, labeling, packaging, and putaway of products. Ensuring forklift operators have proper training and certification, such as those offered by forkliftacademy.com, can contribute to operational efficiency and safety, thereby impacting overall cost management within the supply chain.
- Distribution Network: Breaking down costs related to storing products and moving them to the final point of distribution.
- Outbound Handling: Analyzing pick, pack, and ship costs based on product requirements and customer orders.
- Outbound Freight: Understanding the costs associated with different shipping modes and aligning them with customer delivery requirements.
- Reverse Logistics: Measuring costs related to returns and identifying customers and products that drive significant returns activity.
- SG&A and Overhead Costs: Identifying and measuring the costs of sales, customer service, and other customer-facing functions.
The Cost and Profitability Waterfall:
The cost and profitability waterfall provides a holistic view of the cost and profitability of the entire supply chain. By visualizing the cost components and their impact on profitability, businesses can make data-driven decisions.
Generate cost and profitability waterfall views at various levels within the business hierarchy, allowing for a comprehensive understanding of costs and profitability. The lowest level of granularity, such as individual sales transactions, allows you to analyze the cost and profitability of each transaction. Then summarize this detail at each level by aggregating the costs and profitability at higher levels, such as by the delivery or order, customer, or product.
At the customer level, the cost waterfall helps identify customers with high service costs, enabling targeted conversations for improving efficiency and reducing costs. Similarly, analyzing product costs supports informed negotiations with vendors and suppliers, optimizing pricing, terms, and agreements. Additionally, benchmarking different nodes in the supply chain facilitates operational improvements and better overall performance.
Overall, the cost waterfall visualization enables transparency and clarity in assessing the end-to-end cost structure of the business, facilitating informed decision-making and identification of areas for optimization and improvement.
Calculating Customer Profitability:
Calculating customer profitability can be complex, especially when allocating operating expenses to individual customers. Many companies use a simplistic approach based on the proportional allocation of operating expenses to sales. However, this method has limitations, as it assumes a direct correlation between sales and associated expenses.
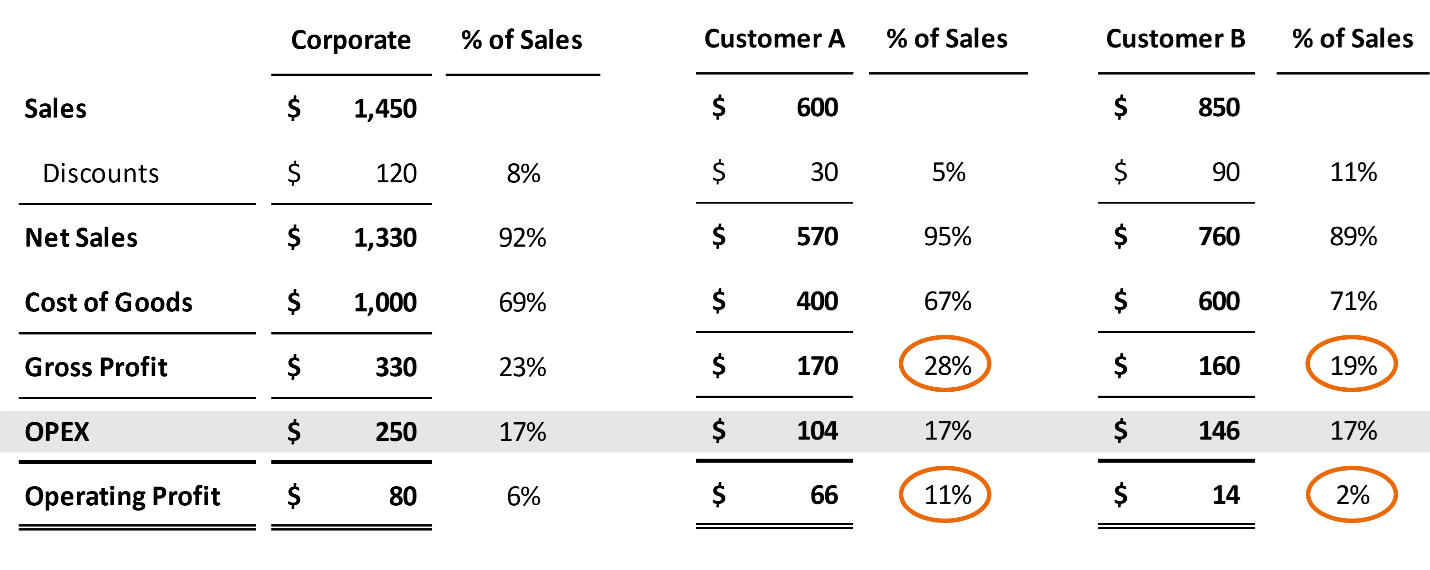
 This means that the percentage of operating expenses to sales at the corporate level is assumed to be the same for each customer. For example, if operating expenses represent 17% of total sales at the corporate level, both customer A and customer B would be allocated 17% of their respective sales as operating expenses.
However, there are limitations to this method. Sales do not always correlate directly with the associated expenses incurred to serve each customer and using sales as a sole basis for allocating operating expenses can lead to misleading profitability analysis. The relationship between sales and expenses is often directional at best, and there is no guarantee that higher sales automatically translate into higher profitability.
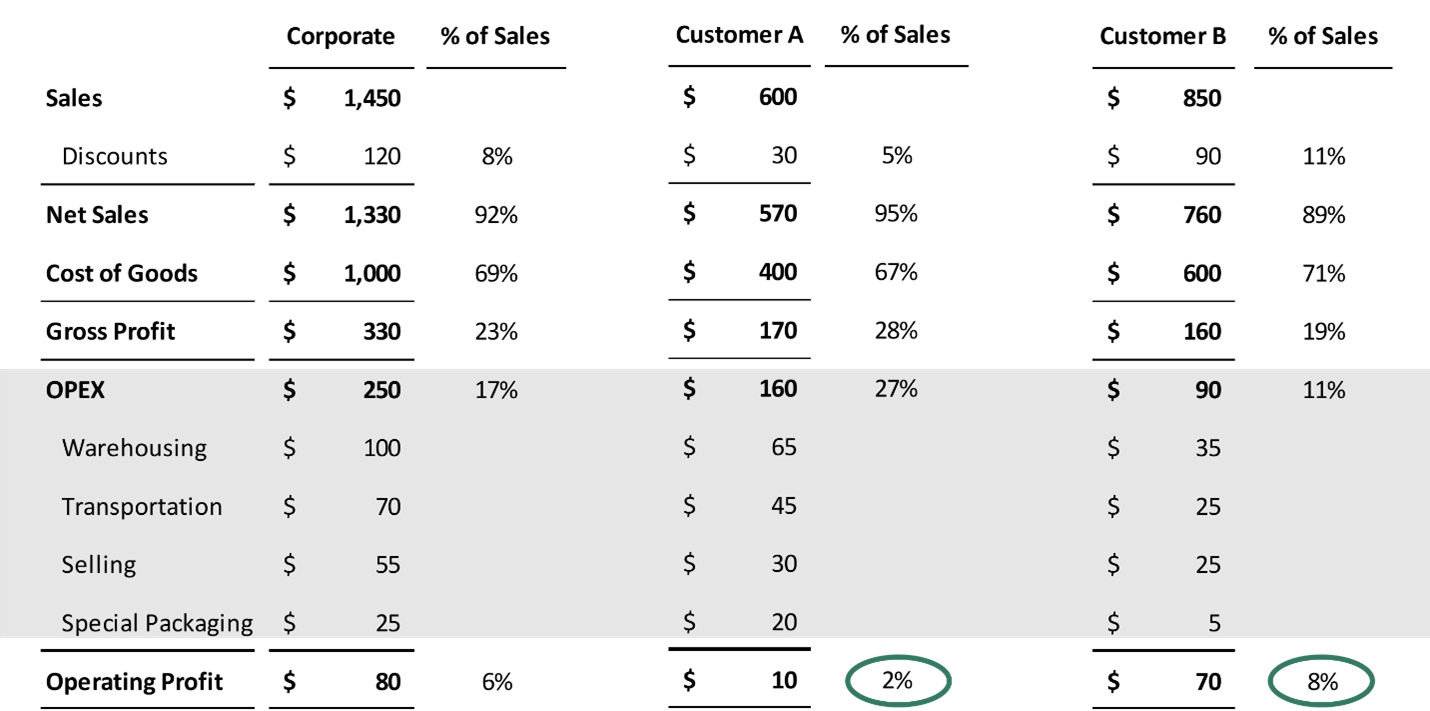
To gain a more accurate understanding of customer profitability, a cost-driver approach is recommended. This involves breaking down the income statement and identifying specific activities or services associated with operating expenses. By allocating costs based on these drivers, businesses gain a more accurate understanding of how costs are incurred for each customer. This approach considers factors beyond sales and provides insights into the profitability generated by individual customers. It allows management to take targeted actions to improve efficiency, reduce costs, and optimize pricing, service levels, or processes.
In the example provided, it turns out that customer A is more profitable than customer B based on gross profit and gross margin analysis and a sales based allocation of operating expenses. This insight may guide the company in decision-making, such as exploring opportunities to expand and grow the business with customer A while potentially entering negotiations with customer B to adjust prices or reduce discounts. This makes sense based on a proportional allocation of OPEX but may be wholly inaccurate if it turns out that customer A’s share of OPEX is higher than customer B’s based on their service requirements.
Real-World Impact:
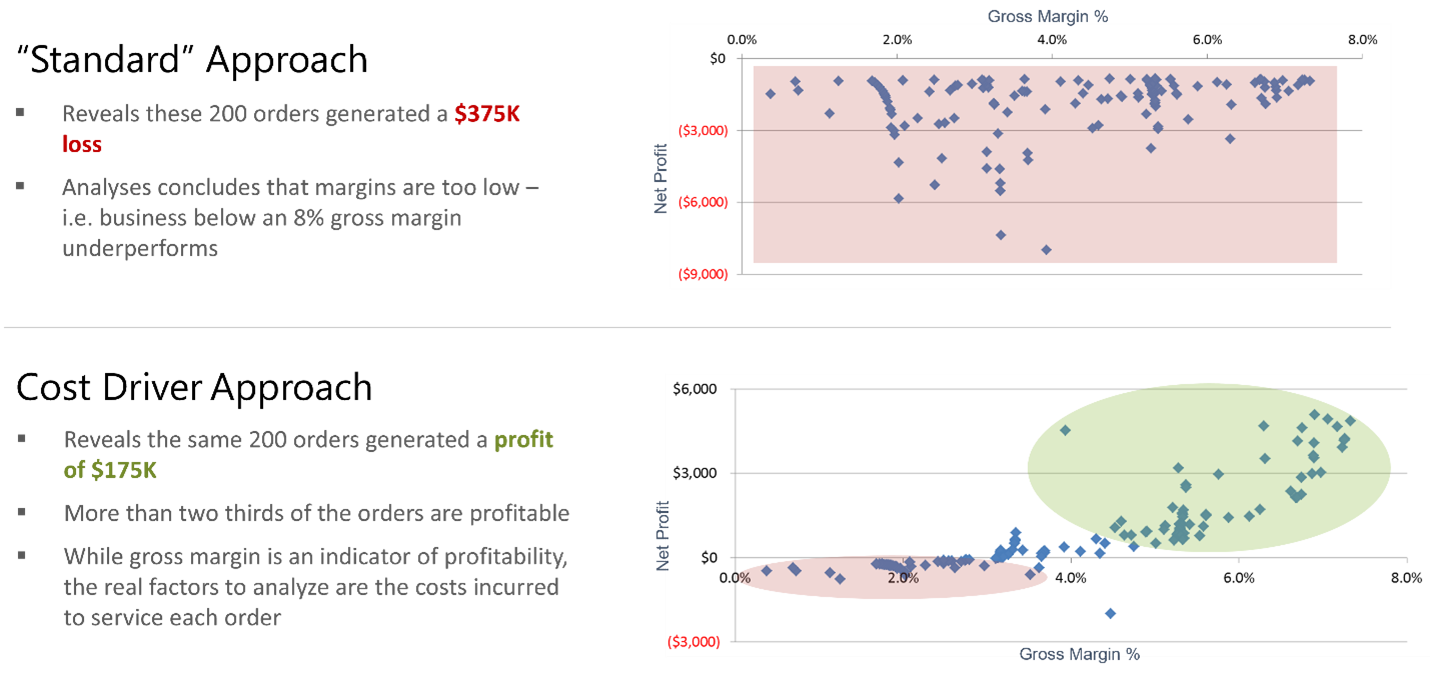
A real-world example illustrates the impact of different profitability calculation approaches on business decisions. Initially, using a generic cost allocation approach, the customer concluded that orders with gross margins below 8% were unprofitable. However, when a cost driver-based approach was applied, it was revealed that the level of service required to fulfill each order significantly impacted profitability.
By considering specific cost drivers, it was revealed that these orders actually generated an overall profit of $175K when actual costs were calculated using the cost driver approach, as opposed to a loss of $375K when using the generic cost allocation approach.
This example highlights the importance of using a more accurate and detailed approach to profitability analysis. By incorporating cost drivers and aligning costs based on the specific activities and services associated with each order, the customer shifted their focus from setting minimum gross margin targets to optimizing customer behavior in order to reduce the expenses incurred in servicing their demand. By understanding the true profitability of each order, they were able to make more informed decisions about pricing, customer segmentation, and operational improvements.
Conclusion:
Achieving end-to-end supply chain cost transparency is crucial for businesses to optimize their operations and enhance profitability. To learn how 3C Software helps companies improve their product and customer profitability analytics process, visit www.3csoftware.com


