
Cost Allocation Reconciliation: Prevent Cost Leakage.
Every profitability conversation eventually reaches the same moment. A product line looks like a loser, a customer looks underwater, or a region misses its margin target, and someone in the room asks: “Are we sure these numbers are right?” How your team answers decides whether the analysis drives a decision or dies in debate.
Most teams struggle to answer, and not because their math is wrong. Their allocation models move cost through four or five stages before it lands on a product or customer, and nobody can prove that every dollar made the trip. When cost slips through a gap along the way, the report still looks finished. It just doesn’t account for all the spending, and nothing on the page tells you so.
The fix isn’t a smarter model. It’s a habit finance teams already apply to the general ledger and almost never apply to their cost models: prove that what went in came out, at every stage.
Key takeaways
- Cost allocation reconciliation confirms that every dollar entering each stage of a multi-stage cost allocation either leaves that stage allocated or sits in a known unassigned residual.
- Most cost allocation errors come from hand-maintained rules, not math: missing account mappings, pools with no destination, broken drivers, colliding overrides, and steps that run out of order.
- A stage-by-stage check catches both unallocated costs (money that disappears) and double-counted costs (money that appears from nowhere), and pinpoints the stage, account, and amount.
- Reconciliation proves completeness, not correctness. Pair it with regular reviews of drivers and allocation logic.
- Build the check into every model run so profitability results are validated before anyone acts on them.
Why does cost allocation reconciliation matter?
Cost allocation reconciliation matters because the cost model now drives decisions as consequential as the financial statements, yet it rarely gets the same controls. Companies built rigorous controls around the general ledger: account reconciliations, close checklists, sign-offs, and external audit. The cost model sits right downstream of that ledger. The ledger balances to the penny. The allocation built on top of it often can’t show where every dollar went.
That gap matters more every year. Profitability reporting has moved from the division to the SKU, customer, and invoice line, which multiplies the rules and handoffs where cost can go astray. Models now re-run weekly or for every pricing scenario, so fewer people review each result. And margin data reaches sales, pricing, and the board, where a single visible error can undermine confidence in an entire profitability program.
The newest pressure is automation. Companies increasingly feed cost and margin data into pricing engines, planning tools, and AI assistants. A seasoned analyst brings a gut check; automated systems don’t. If a portion of overhead never reaches the customer profitability model, AI-assisted pricing recommendations may rely on understated costs, potentially reinforcing poor pricing decisions at scale.
The real cost of a leak isn’t the missing dollars. It’s the decision someone makes on a distorted margin, and the trust you lose when someone else finds the gap first.
What causes cost allocation errors?
Most cost allocation errors come from the rules around the math, not the math itself. When an allocation produces a wrong answer, the instinct is to question the methodology. But the usual culprits are the mappings, driver tables, exceptions, and run sequences that people maintain by hand and that drift as the business changes.
Often, the deeper issue is ownership and governance. Finance owns the GL, operations owns the driver data, a few analysts maintain the routing logic, and IT owns the systems. Each group keeps its piece accurate, but nobody is accountable for whether the whole chain holds together. Five causes account for most allocation discrepancies:
- An account with no rule. A GL account carries spending, but no allocation rule points it anywhere downstream. Example: finance adds a “software subscriptions” account mid-year. It posts $4,200 in March, but nobody routes it, so the $4,200 never reaches a cost pool.
- A pool with no exit. A cost pool receives money from upstream but nobody wired it to send that money on. Example: a $15,000 facilities pool collects rent and utilities, but no rule moves it into warehouse, counter, and delivery activities. The cost arrives and stays stuck.
- A zeroed-out or broken driver. Someone sets a driver weight to zero, or the driver data comes in empty, so the cost has nowhere to go. Split percentages that don’t add up to 100% cause the same trouble in reverse. Example: a branch’s quarterly warehouse time survey comes back blank, so the warehouse share of salaries has an empty denominator and drops out.
- Exceptions and overrides that collide. Many models layer rules: a default policy, plant-level exceptions, then manual overrides on individual lines. Each layer is another place for a gap or a double count. Example: the default spreads depreciation by shipped tons, a plant exception switches Plant A to machine hours, and an analyst adds a line override at Plant A. If the override doesn’t cleanly replace the exception, $200,000 of depreciation can land on products twice.
- Steps that run out of order. A multi-stage model is a chain of dependent calculations. Run one early, skip one, or let a downstream step read last month’s upstream number, and the result looks plausible but is wrong. Example: the invoice-line step runs before the second round of pool allocations finishes, so it spreads only the first-round balances.
Depending on the model’s controls, these issues may not trigger an error. The model runs, the report renders, and the total is simply wrong. By the time a margin reaches a pricing or product decision, the gap is buried under three or four layers of allocation.
How does stage-by-stage reconciliation work?
Stage-by-stage reconciliation compares what enters each stage of a multi-stage cost allocation with what leaves it, then flags any difference. Put simply, it puts a flow meter at every junction. Think of your allocation as a chain of connected pipes. Spending enters at the GL, passes through junctions for assignment, cost pools, and activities, and exits onto invoice lines. A stage-by-stage conservation check installs a meter at each junction. The meter reads what flowed in, reads what flowed out, and reports the difference.
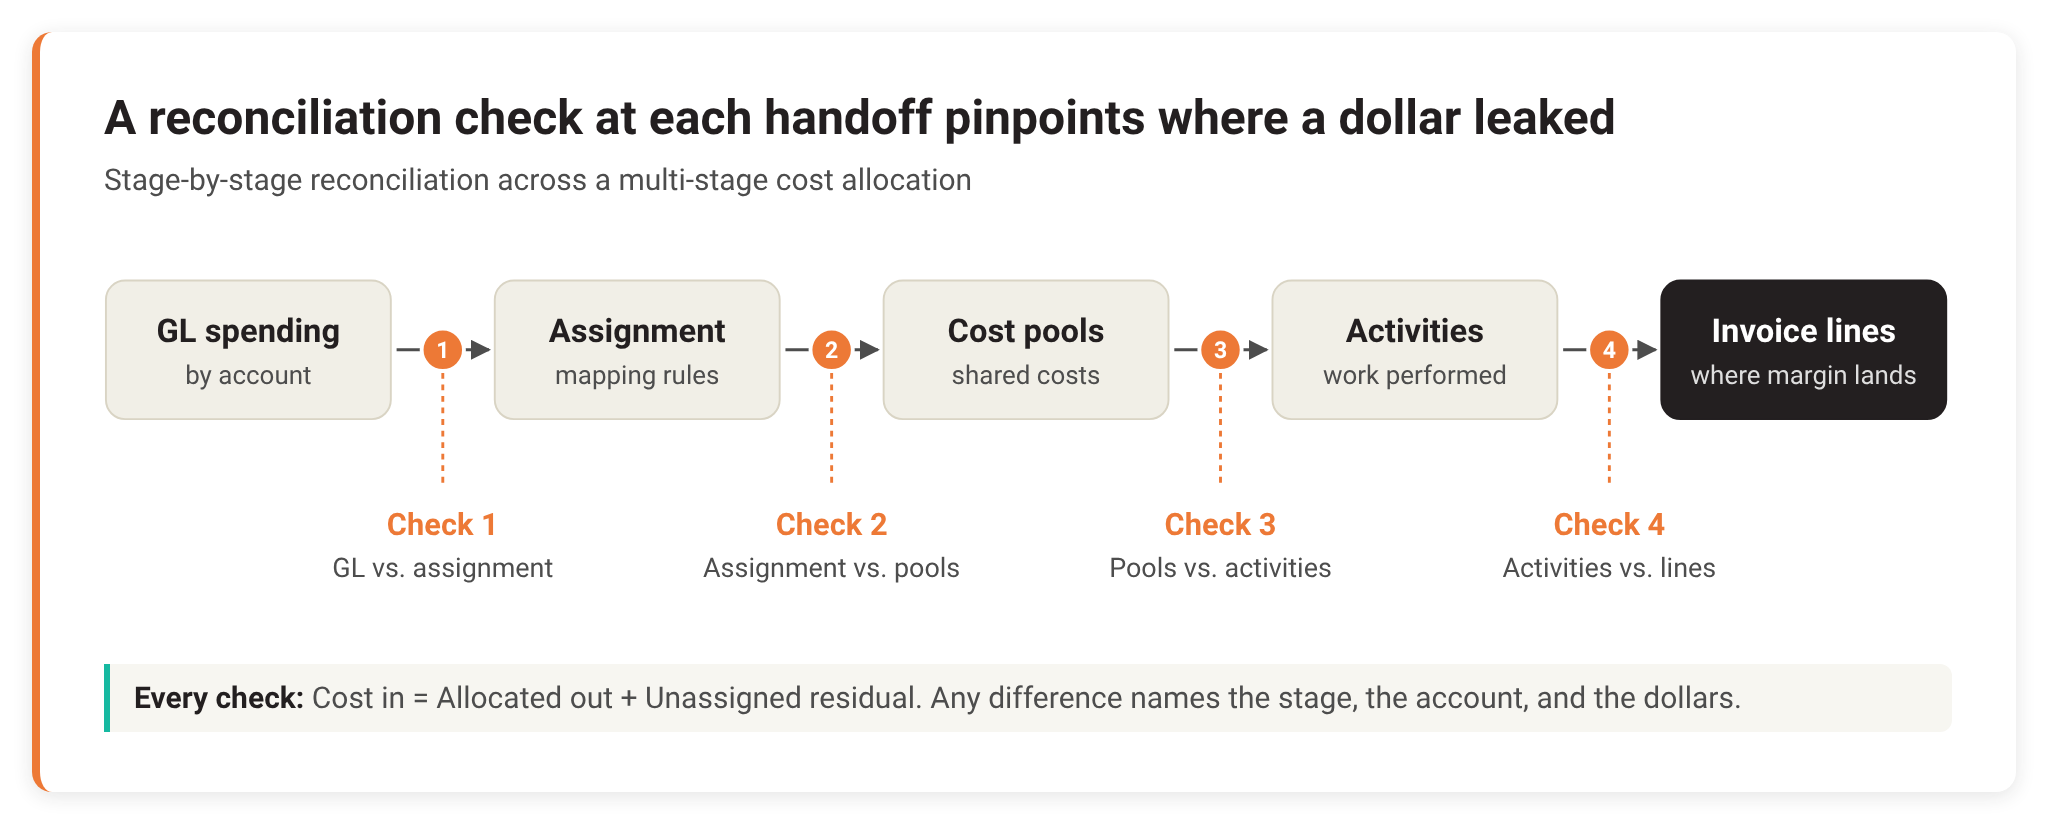
Because each meter tests one handoff, a failed check tells you exactly which junction to open up.
A zero difference confirms that the stage’s recorded inputs and outputs balance. A positive difference means cost leaked. A negative difference means more came out than went in, which usually means something got counted twice. An amount that shows up on only one side of the meter is also a red flag, signaling an unexpected source or a missing destination.
One wrinkle matters. Many models deliberately hold back some cost as an “unassigned” residual, a designated overflow bucket. The check counts that residual on the output side, so the test at every stage becomes:
Cost in = Allocated out + Unassigned residual
If allocated plus unassigned doesn’t equal the input, in either direction, you have a true discrepancy. Because you test each junction separately, the check tells you which stage leaked, which account or pool it came from, and the exact dollar amount.
Treat the residual as a to-do list, not a rounding bucket. Each dollar in it belongs to an account that still needs a routing decision. Keep in mind that accounted for is not the same as allocated: a stage can pass the check while that cost still sits outside product and customer profitability.
Tracking residuals over time helps you tell temporary exceptions from recurring gaps. A growing balance may signal that allocation rules are falling behind changes in the business. A persistent balance deserves investigation even when it stays stable.
Cost allocation reconciliation examples
Example 1: $2,000 that never arrived
Say your GL records $100,000 of spending for the month across three accounts. After the allocation run, you compare what the GL showed against what the assignment layer produced:
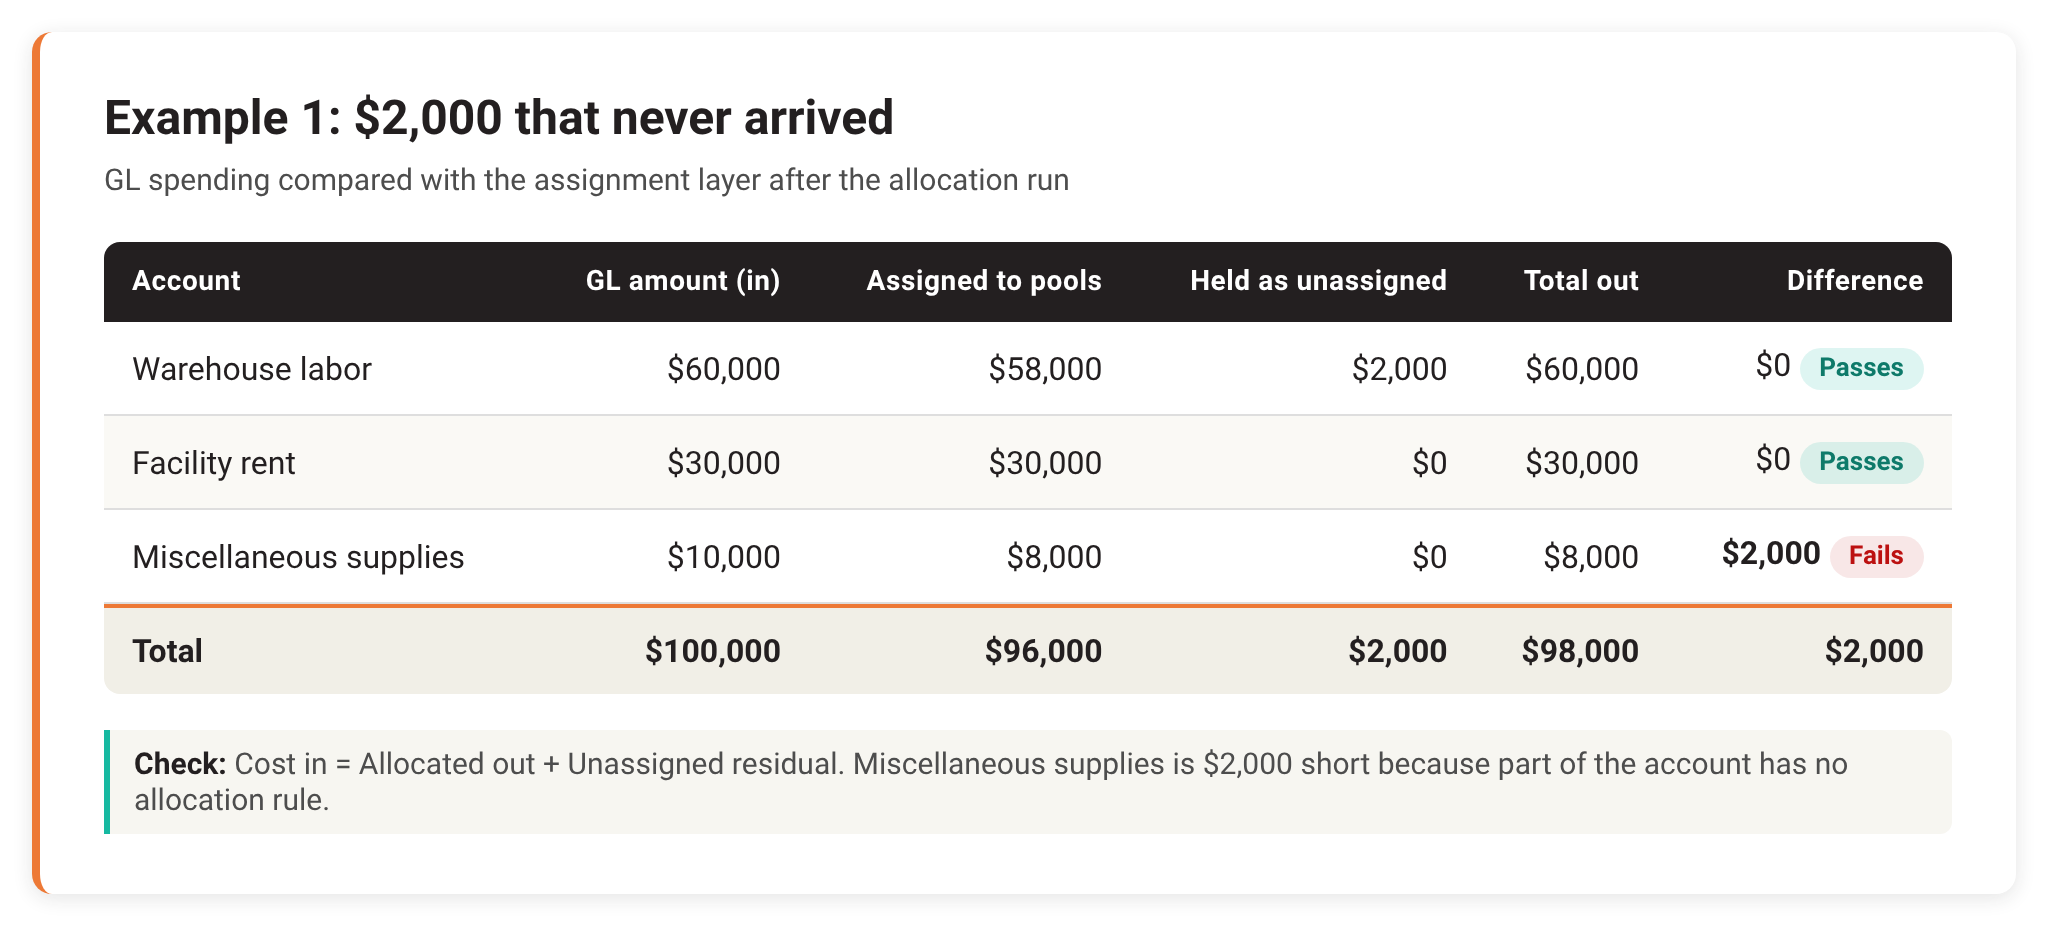
Warehouse labor and facility rent pass, because assigned plus unassigned equals what the GL recorded. Note that warehouse labor holds $2,000 as an intentional residual, and the check still treats it as accounted for.
Miscellaneous supplies fails. $2,000 entered the stage, but part of the account never received an allocation rule, so neither bucket captured it. The check names the account and the gap, the analyst adds the missing rule, and the re-run shows $0 on every line. Now all $100,000 is accounted for: $98,000 flows on to cost pools and activities, and the $2,000 warehouse labor residual stays visible until someone decides where it belongs.
Without the check, $2,000 would vanish without a trace, and downstream margins would rest on $96,000 of allocated cost instead of $98,000. Every product and customer would look slightly more profitable than it is, and no one would know why. Two percent sounds small until it’s the difference between keeping a product line and cutting it.
Example 2: $750 that came from nowhere
Leaks get the attention, but the check works in both directions. Consider the stage where cost pools feed activities. A distributor’s $15,000 facilities pool splits into three activities by floor space. Last quarter, delivery’s staging area grew, and someone raised its share from 25% to 30% without lowering the others.
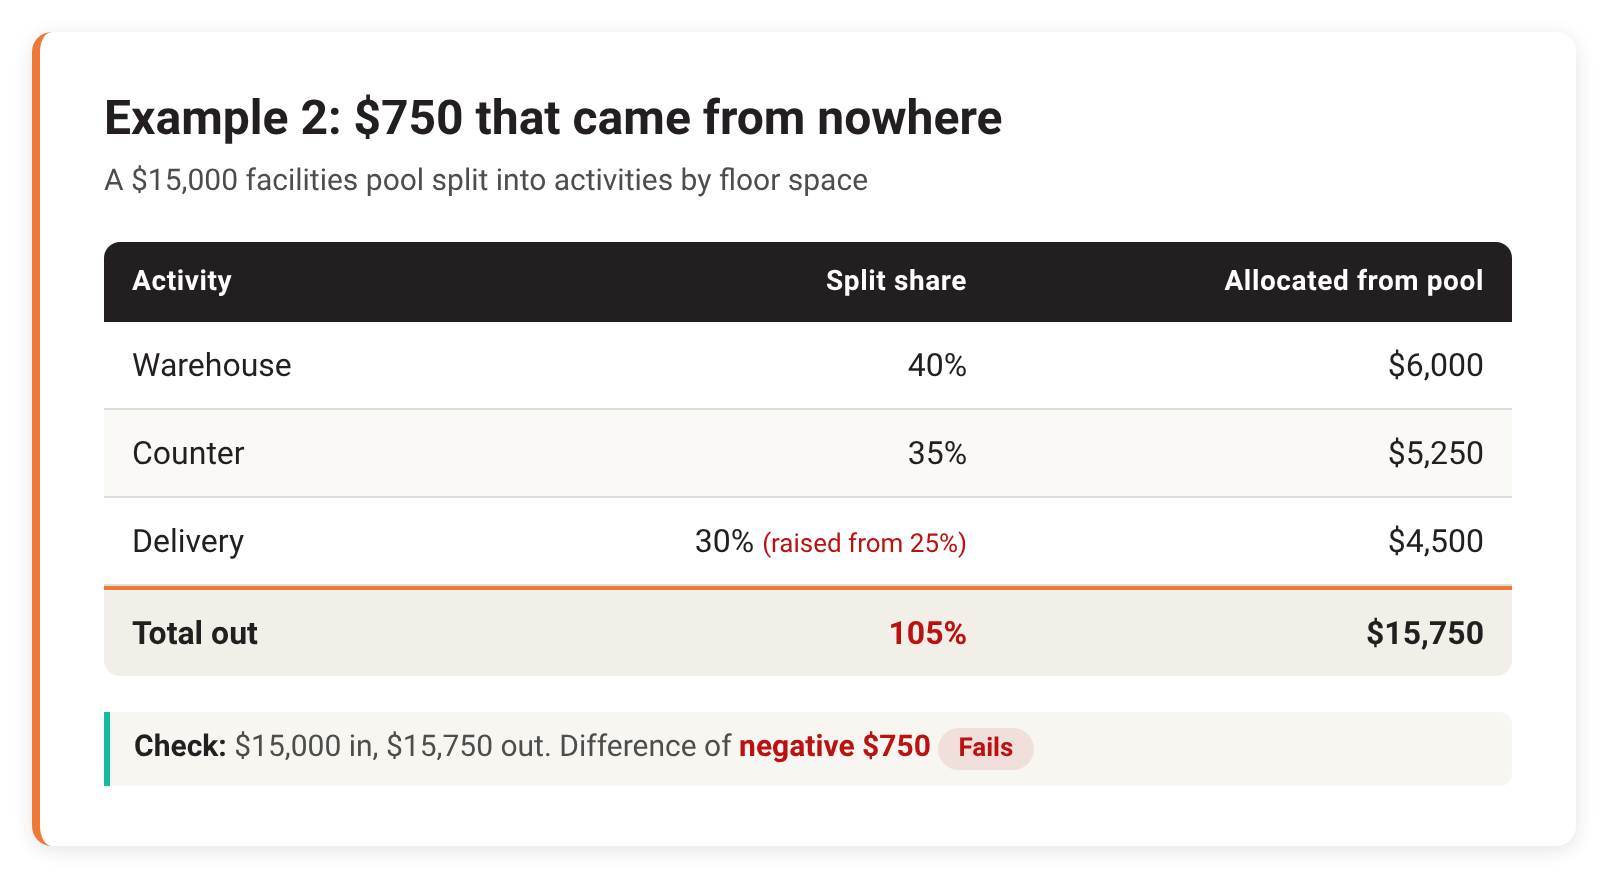
$15,000 went in and $15,750 came out, a difference of negative $750. Nothing looks broken in any single row. The check catches it because the totals don’t match, and the fix takes minutes: rebalance the shares to 100% and re-run.
Left alone, that $750 inflates cost on every delivery-heavy order. Some customers start to look unprofitable when they aren’t. That’s how a pricing team ends up raising prices on accounts that were already paying their way, and sometimes losing them.
What reconciliation can and can’t tell you
A clean reconciliation proves that costs are accounted for. It does not prove they were allocated correctly. Those are different questions, and confusing them is how a well-controlled model still produces misleading margins.
What it can do: extend beyond totals
The same conservation idea applies to how cost breaks down, not just how much there is. Two checks are worth adding once the basic one runs clean.
Cost behavior survives every stage. If you carry material, variable, and fixed cost separately for marginal decisions, the parts must equal the total at every tier. Example: a bulk product costs $100, made up of $36 material, $27 variable, and $37 fixed. If the packaging stage inherits $100 but its split shows only $35 of fixed, $2 of fixed cost has quietly turned into nothing, and every make-vs-buy comparison downstream understates it.
Stage contributions add up to the whole. If you report how much each stage contributed to a product’s all-in cost, those pieces must sum to the total. Example: a pack costs $1.16 all-in. Ingredient production contributes $0.33, bulk manufacture $0.47, packaging $0.26, and market landing $0.10, which sums to $1.16. If one stage subtracts the wrong inherited amount, the pieces stop matching the total, and the stage that looks most expensive may not be.
What it can’t do: confirm the drivers are right
A model can allocate 100% of warehouse overhead by headcount when handling time would reflect the work far better. Every stage balances, and customer profitability is still distorted. The same goes for outdated survey data, a driver that no longer matches how the business operates, or an allocation rule nobody has questioned in years.
That’s why reconciliation should be one part of a broader cost model validation process, alongside regular reviews of driver accuracy, allocation logic, and the business assumptions behind them. Reconciliation tells you the model is complete. Driver reviews and business sense-checks tell you it’s right. You need both before the numbers reach a pricing decision.
How to build reconciliation into your costing process
Reach for a stage-by-stage reconciliation when any of these apply:
- You run a chained allocation. GL to pools to activities to transactions, or any similar chain where one silent gap distorts every number downstream.
- Decisions depend on the output. Product cost, customer margin, or profitability feeds pricing, management reporting, or financial statements, and someone will ask how you know it’s complete.
- People maintain the rules. Account mappings, driver weights, plant exceptions, and manual overrides drift when the chart of accounts or the org structure changes.
- Stages depend on each other’s output. Downstream steps read numbers that upstream steps publish, and you can’t always guarantee the run order.
- You just finished a run. You want to sign off on results before you distribute them.
To make it stick, treat it as a quality gate in your monthly close, not an occasional audit:
- Make the check a required step in your recalculation sequence, in every run mode. A quick plant-level refresh needs it as much as the full month-end close.
- Before the run, confirm that every split table adds up to 100%.
- After the run, report one row per account or pool at each stage, with in, out, unassigned, and difference.
- Set the pass threshold at $0, or at a small rounding tolerance you agree on in advance. Flag differences in both directions.
- Track the unassigned residual month over month, and give each item an owner.
- Hold distribution of profitability results until every stage passes.
- Log each failure and its fix, so recurring gaps point you to the rules that need better ownership.
Once configured, automated reconciliation checks add little overhead to each run. They won’t stop errors from happening, but they catch them in minutes instead of after a bad decision.
Frequently asked questions
What is cost allocation reconciliation?
It’s a control that confirms every dollar entering each stage of a cost allocation either leaves that stage allocated or sits in a known unassigned residual. Because it runs stage by stage, any discrepancy points to a specific stage, account or pool, and dollar amount.
How do you identify unallocated costs?
Compare each stage’s inputs with its allocated outputs plus any intentional residual, at the account or pool level. The usual sources are accounts with spending but no allocation rule, pools with no downstream destination, and drivers with empty or zero values.
What is the difference between unassigned and unallocated costs?
Unassigned costs are known and visible: the model deliberately holds them in a residual until someone decides where they belong. Unallocated costs are missing: they entered a stage and never came out, usually because a rule or driver is broken. A reconciliation counts unassigned costs as accounted for and flags unallocated costs as a discrepancy.
Can a cost allocation model balance and still be inaccurate?
Yes. Reconciliation confirms completeness, not correctness. A model can account for every dollar while using outdated drivers or rules that send cost to the wrong products or customers. Pair reconciliation with regular reviews of drivers and allocation logic.
How often should you reconcile cost allocations?
After every model run, including partial refreshes and scenario runs. Automated checks make that practical even when models run weekly.
How ImpactECS supports cost allocation reconciliation
The challenge isn’t understanding how to reconcile an allocation. It’s applying that discipline consistently across hundreds or thousands of allocation rules, multiple costing stages, and frequent recalculations. As cost models grow more complex, reconciliation needs to become part of the modeling process rather than a separate manual exercise.
ImpactECS, the cost and profitability platform from 3C Software, helps finance and operations teams build that discipline into the model itself:
- Transparency and control over how costs flow. Allocation rules, drivers, and exceptions live in configurable tables that finance can review and adjust, rather than in hard-coded logic.
- Allocation gaps surface before they distort profitability. Unassigned costs stay visible, so analysts can resolve them instead of discovering them in a margin review.
- Completeness you can validate and trace. Reconciliation calculations can confirm that each stage balances and point to the account, pool, and amount behind any discrepancy.
- Consistent results across recalculations and scenarios. Controlled calculation sequences run each step in the right order, whether it’s a quick refresh or a full close.
- Visibility into what drives cost. Models can preserve cost components and stage-level contributions, so teams can explain a margin, not just report it.
Closing thought
It’s not enough to know that every dollar was allocated. Finance teams also need to know where costs went, why they went there, and whether the resulting profitability information is reliable enough to support decisions. Reconciliation is the foundation for answering the rest.
Here’s a simple test: if your CFO asked tomorrow for proof that every dollar of last month’s overhead reached a product or customer, how long would it take to answer? If the answer is days, or “we can’t,” start with the first junction.
To see how ImpactECS helps teams build cost and profitability models they can validate and explain, visit 3csoftware.com.