ImpactECS In-Depth: Unlocking ImpactECS Report Types
ImpactECS supports two reporting approaches – external integration with third-party reporting tools and internal reports using ImpactECS Report Types. Most ImpactECS implementations employ both practices and the distribution of reporting activities across platforms depends on the reports needed and the audiences consuming their data.
This article focuses on internal reporting options available with ImpactECS’ integrated report builder. The built-in functionality provides multiple reporting types to create reports that help measure performance, predict trends, define goals, and compare benchmarks in your organization.
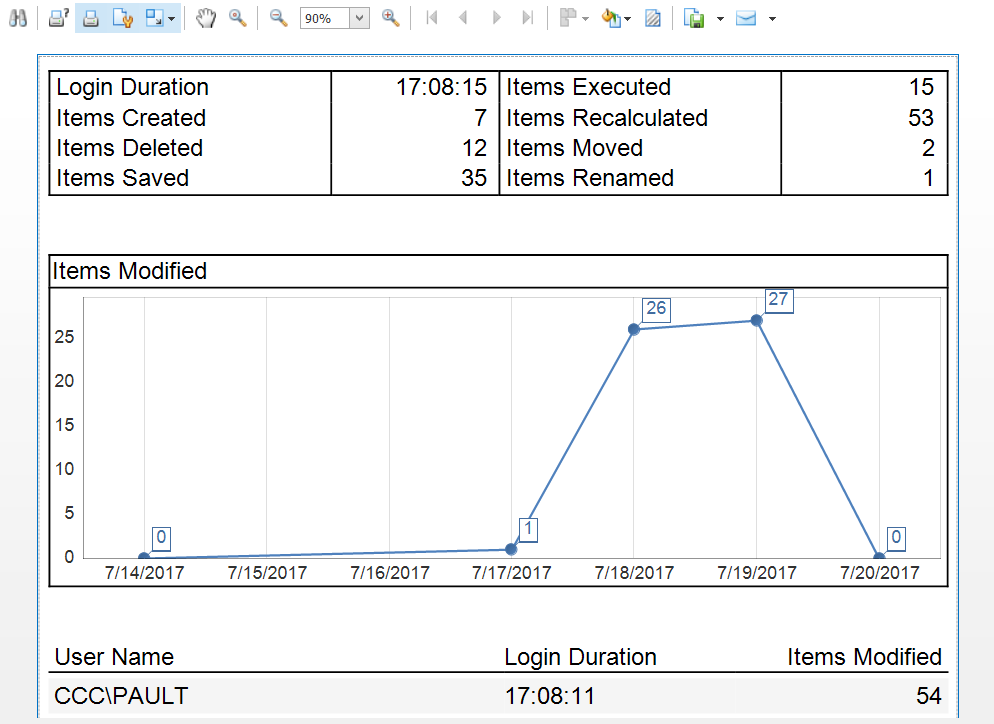
Report Type: Traditional Reports
ImpactECS Traditional Reports used in instances where paper-based or formal reports are necessary. While there are many use cases for printed reports, the most common Traditional Report for ImpactECS users is the Cost Sheet which shares the detailed cost elements associated with a specific product.
By accessing the Design Panel in ImpactECS, users can define the Report Bands (headers, footers, content, records) and Report Controls to publish reports. There are several available report controls – including data tables, graphs, charts, and pivot tables – available in the report designer to create any desired report template.
Another feature of Traditional Reports is the ability to email HTML reports. Using a Script Module, report builders export the report as HTML and embed the resulting code into the body of an email message.
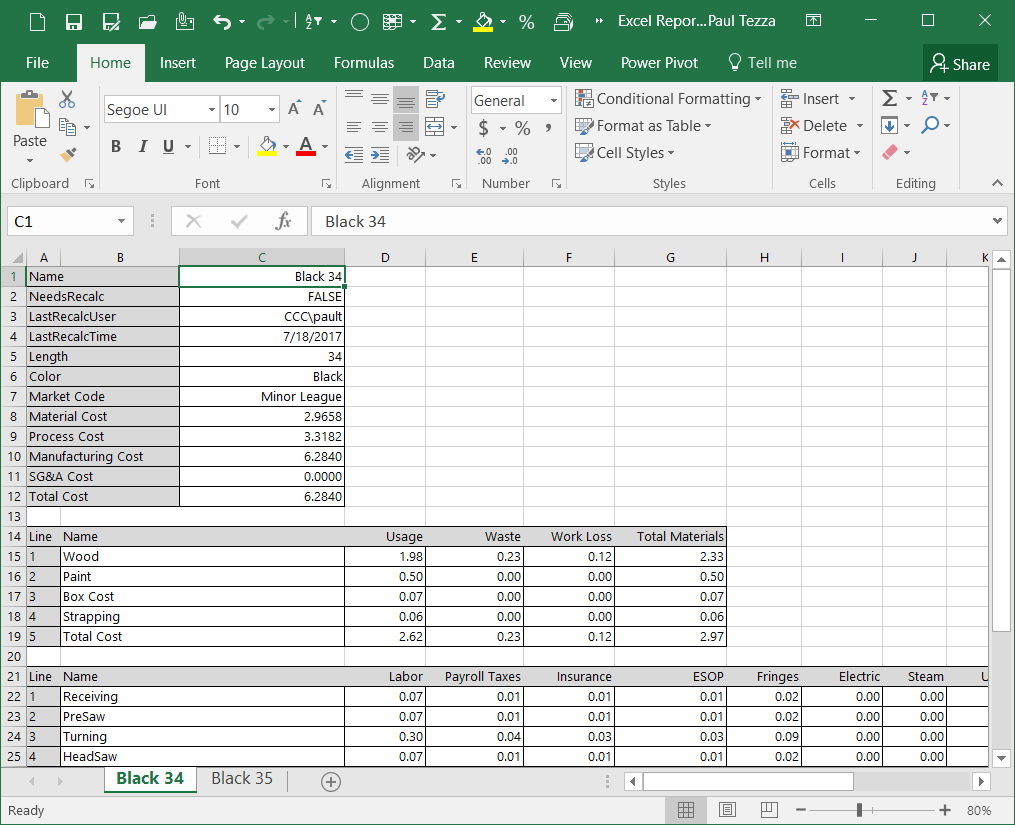
Report Type: Excel Reports
To simply view ImpactECS items and results in a Microsoft Excel® workbook, Excel Reports is the best reporting option. Excel Reports are easy to create, modify and share and they don’t have the formatting constraints of traditional reports.
Creating Excel Reports in ImpactECS requires the Excel Add-in which is loaded during installation of the Desktop Client. The drag-and-drop interface makes it simple to add available data fields (based on selected source object) and template markets are automatically generated to define where data appears on the report worksheet.
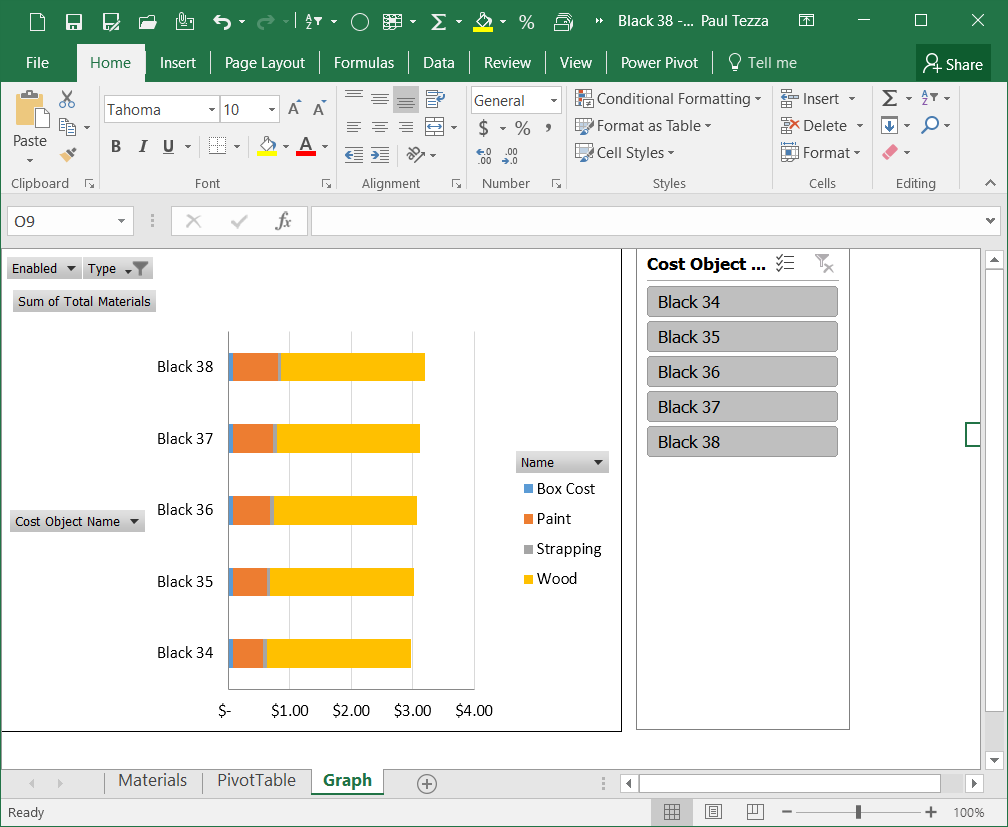
Report Type: Analytical Reports
In some cases, just having the ability to view ImpactECS data in Excel is too limited. For expanded analytical capabilities, the Analytical Report option is an Excel-based report that supports more functionality.
Instead of Template Markets, Analytical Reports export actual ImpactECS Item data into separate worksheets and Excel tables. Once the data is downloaded to the workbook, the integrated WYSIWYG report designer gives users the ability to add, delete and hide data, build pivot tables, and include charts and graphs.
Report Type: Dashboards
Dashboards are a handy way to share and visualize data by creating compelling, interactive reports. Typically, dashboards combine key performance measurements from various data sources, making it easier to monitor overall performance of product groups, departments, customers, or other alignments. ImpactECS Dashboards include a wide range of elements – pivots, grids, charts, gauges, maps, cards and more – to deliver information in a meaningful and engaging manner.
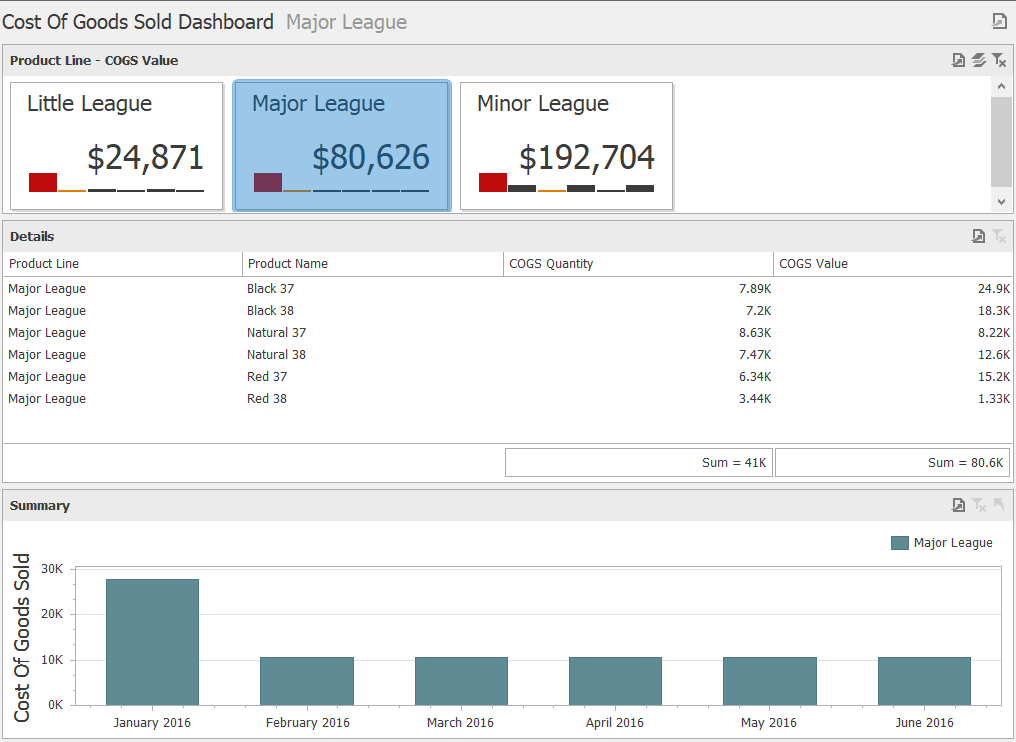
To learn more about Dashboards, read the article ImpactECS In-Depth: Leveraging Dashboards.
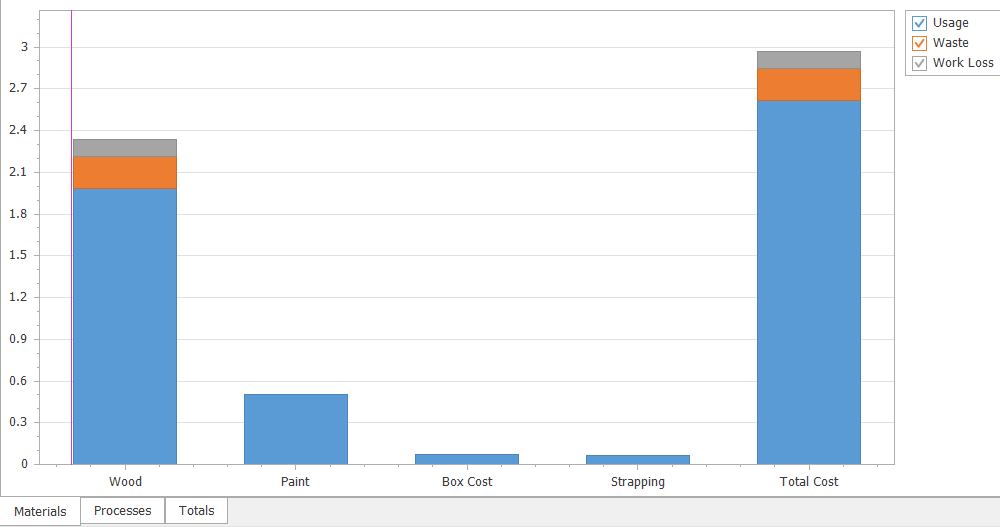
Report Type: Integrated Charts
Get access to data visualization tools for ad-hoc reporting inside ImpactECS items using Charts. ImpactECS offers more than 60 different 2D and 3D chart types from simple bar and pie charts to more complex visuals like stock and candle stick reports.
Launching the Chart Wizard takes users through a step-by-step process to design and edit charts in the ImpactECS data grid.
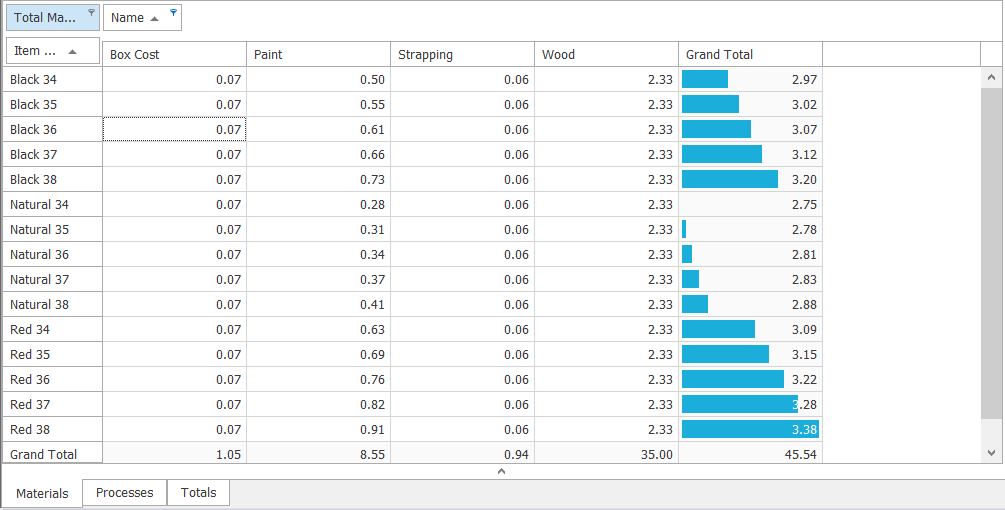
Report Type: Pivot Tables
To summarize and rearrange data sets, ImpactECS offers pivot table functionality inside the data grid. Pivot tables give users the ability to generate powerful ad-hoc analysis without changing the underlying data structure.
Creating pivot tables is straightforward in ImpactECS. Using the integrated pivot table builder, users simply select, sort, position and chart data for any ImpactECS data grid.
A Note About Queries
While not a specific ImpactECS report type, Queries are often used select report data necessary for ImpactECS reports. Queries can collect source data from external relational database tables or ImpactECS tables for use in any of the report types.
Before Building the First Report
The integrated report builder is a flexible tool that makes it possible to build an unlimited number of reports. But to build reports that get use, it is important to have a plan of attack before building the first report. Start by defining the objective and identifying the best metrics. A clear understanding of these two areas will help determine the best reporting option to choose for your data set. Once established, build reports that present useful information in a compelling and straightforward format that engages the audience and delivers actionable results.