
ImpactECS In-Depth: Waterfall Charts for P&L Statements
Waterfall charts are a great way to tell a visual story about cumulative effects. According to Wikipedia, “The waterfall, also known as a Bridge or Cascade chart, is used for understanding how an initial value is affected by a series of intermediate positive or negative values.” With the initial and final value columns at either end, the intermediate columns designate the impact of each contributing value leading to the final result. For finance and accounting teams, waterfall charts are a useful way to represent profit and loss (P&L) statements in an engaging way.
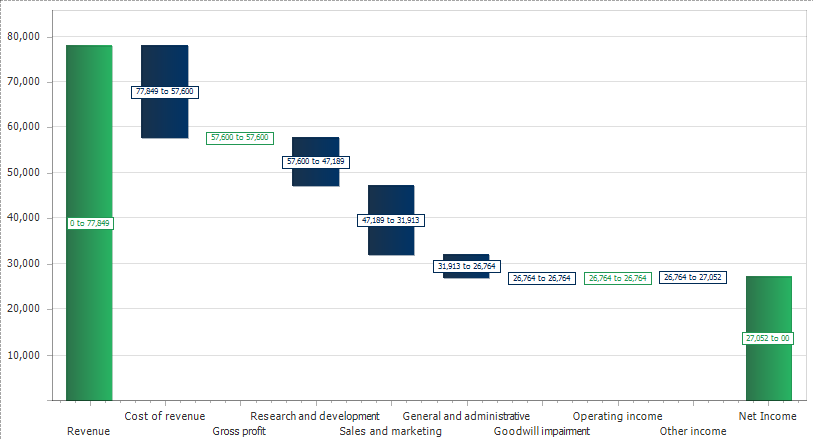
Calculating Data for Waterfall Charts
For P&L statements, the waterfall chart visually defines the revenues and expenses by category incurred over a specific period. Typically, the source data comes from the company general ledger or other financial consolidation tool and is assembled in ImpactECS to form the foundation of the corporate income statement.
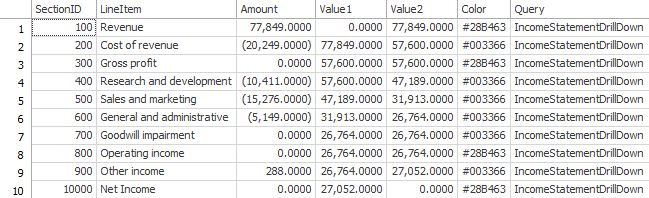
In this example, the table includes the SectionID, LineItem and Amount columns that are extracted directly from the general ledger. The two Value columns calculate the values necessary to generate the waterfall columns, with Value1 equal to Value2 of the previous row. Validate the results by confirming the Value2 column equals the sum of the Value1 column and the Amount column.
Building Waterfall Charts
Once the data is calculated and stored in an ImpactECS Query or Table, there are three ways to display waterfall charts in the application – within an Item, on a Dashboard, or on a Report.
Option 1: Within an Item
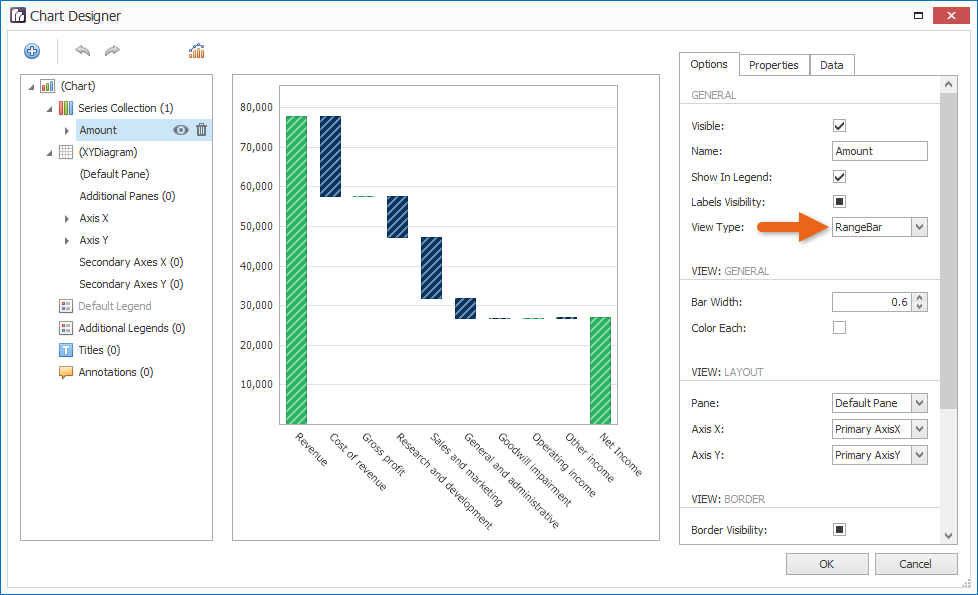
From the Chart Designer, use the “RangeBar” type to build waterfall charts to embed inside an ImpactECS object. The Options tab is used to set the style and display items, and the Data tab is the mechanism to select and assign the relevant data.
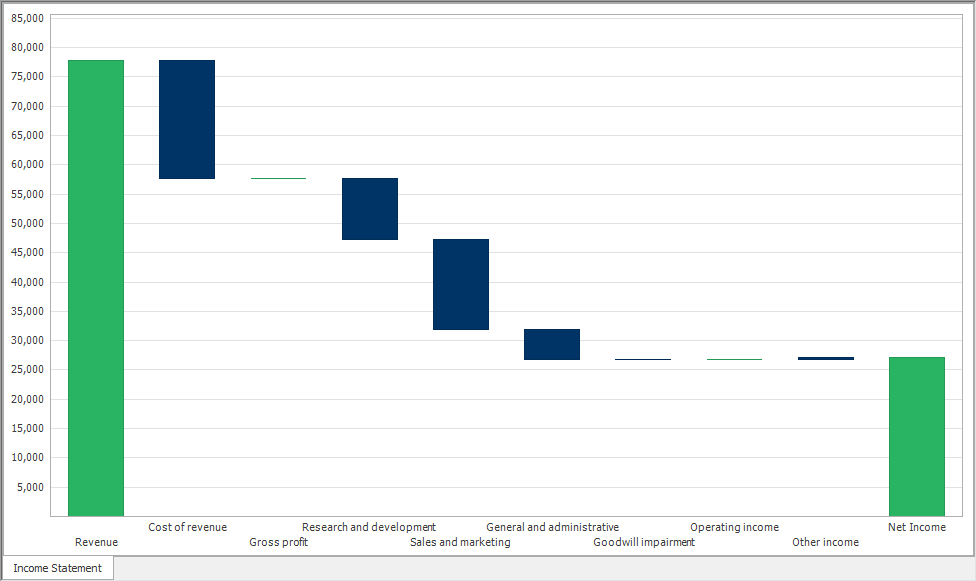
Embed waterfall charts for Items that contain data – Cost Objects, Queries, or Tables.
Option 2: On a Dashboard
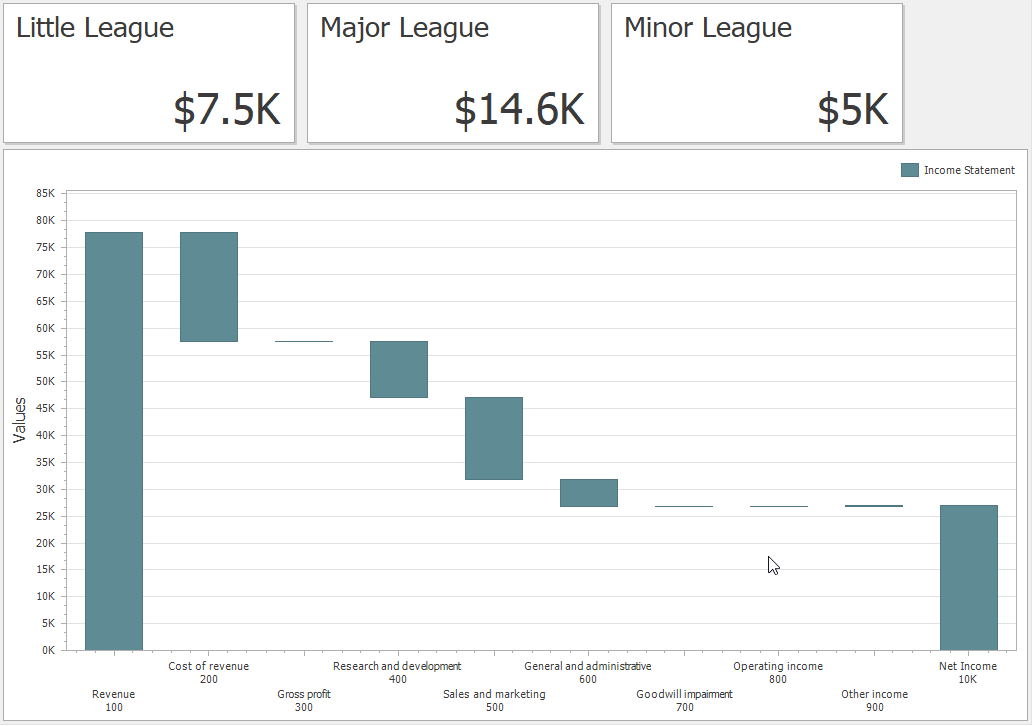
The ImpactECS Dashboard Designer provides tools to display waterfall charts as dashboard widgets alongside other critical data and KPIs. Build P&L dashboards to provide a complete view of performance with the ability to filter and drill down into the results for detailed analysis. Use the “RangeBar” type to build waterfall charts for Dashboards.
Option 3: On a Report
Make traditional P&L reports more engaging by adding visual context to the results with waterfall charts embedded in standardized and print-based reports. From the ImpactECS Report Designer, choose the “RangeBar” type to configure the chart.
As one of the many charting options available in ImpactECS, waterfall charts offer a useful way to communicate P&L performance in a complete way. Along with the ability for model users to drill-down into any waterfall element, these charts are a powerful way to quickly investigate root causes or identify trends contributing to profitability. If you have questions on getting started with waterfall charts in ImpactECS, email our support team and we’re happy to help out!