Infographic: Problems with Excel Spreadsheet Analytics
Many companies use Excel spreadsheets to calculate costs, value inventories, estimate profits, analyze scenarios and report results. But the problems with Excel spreadsheet analytics are far reaching – affecting data entry, scalability, sharing and security, and system integration to highlight a few. Most finance professionals spend an average of 18 hours every month updating, consolidating, revising, modifying and correcting spreadsheets in an uphill effort to answer more questions, provide more detailed answers, and respond faster.
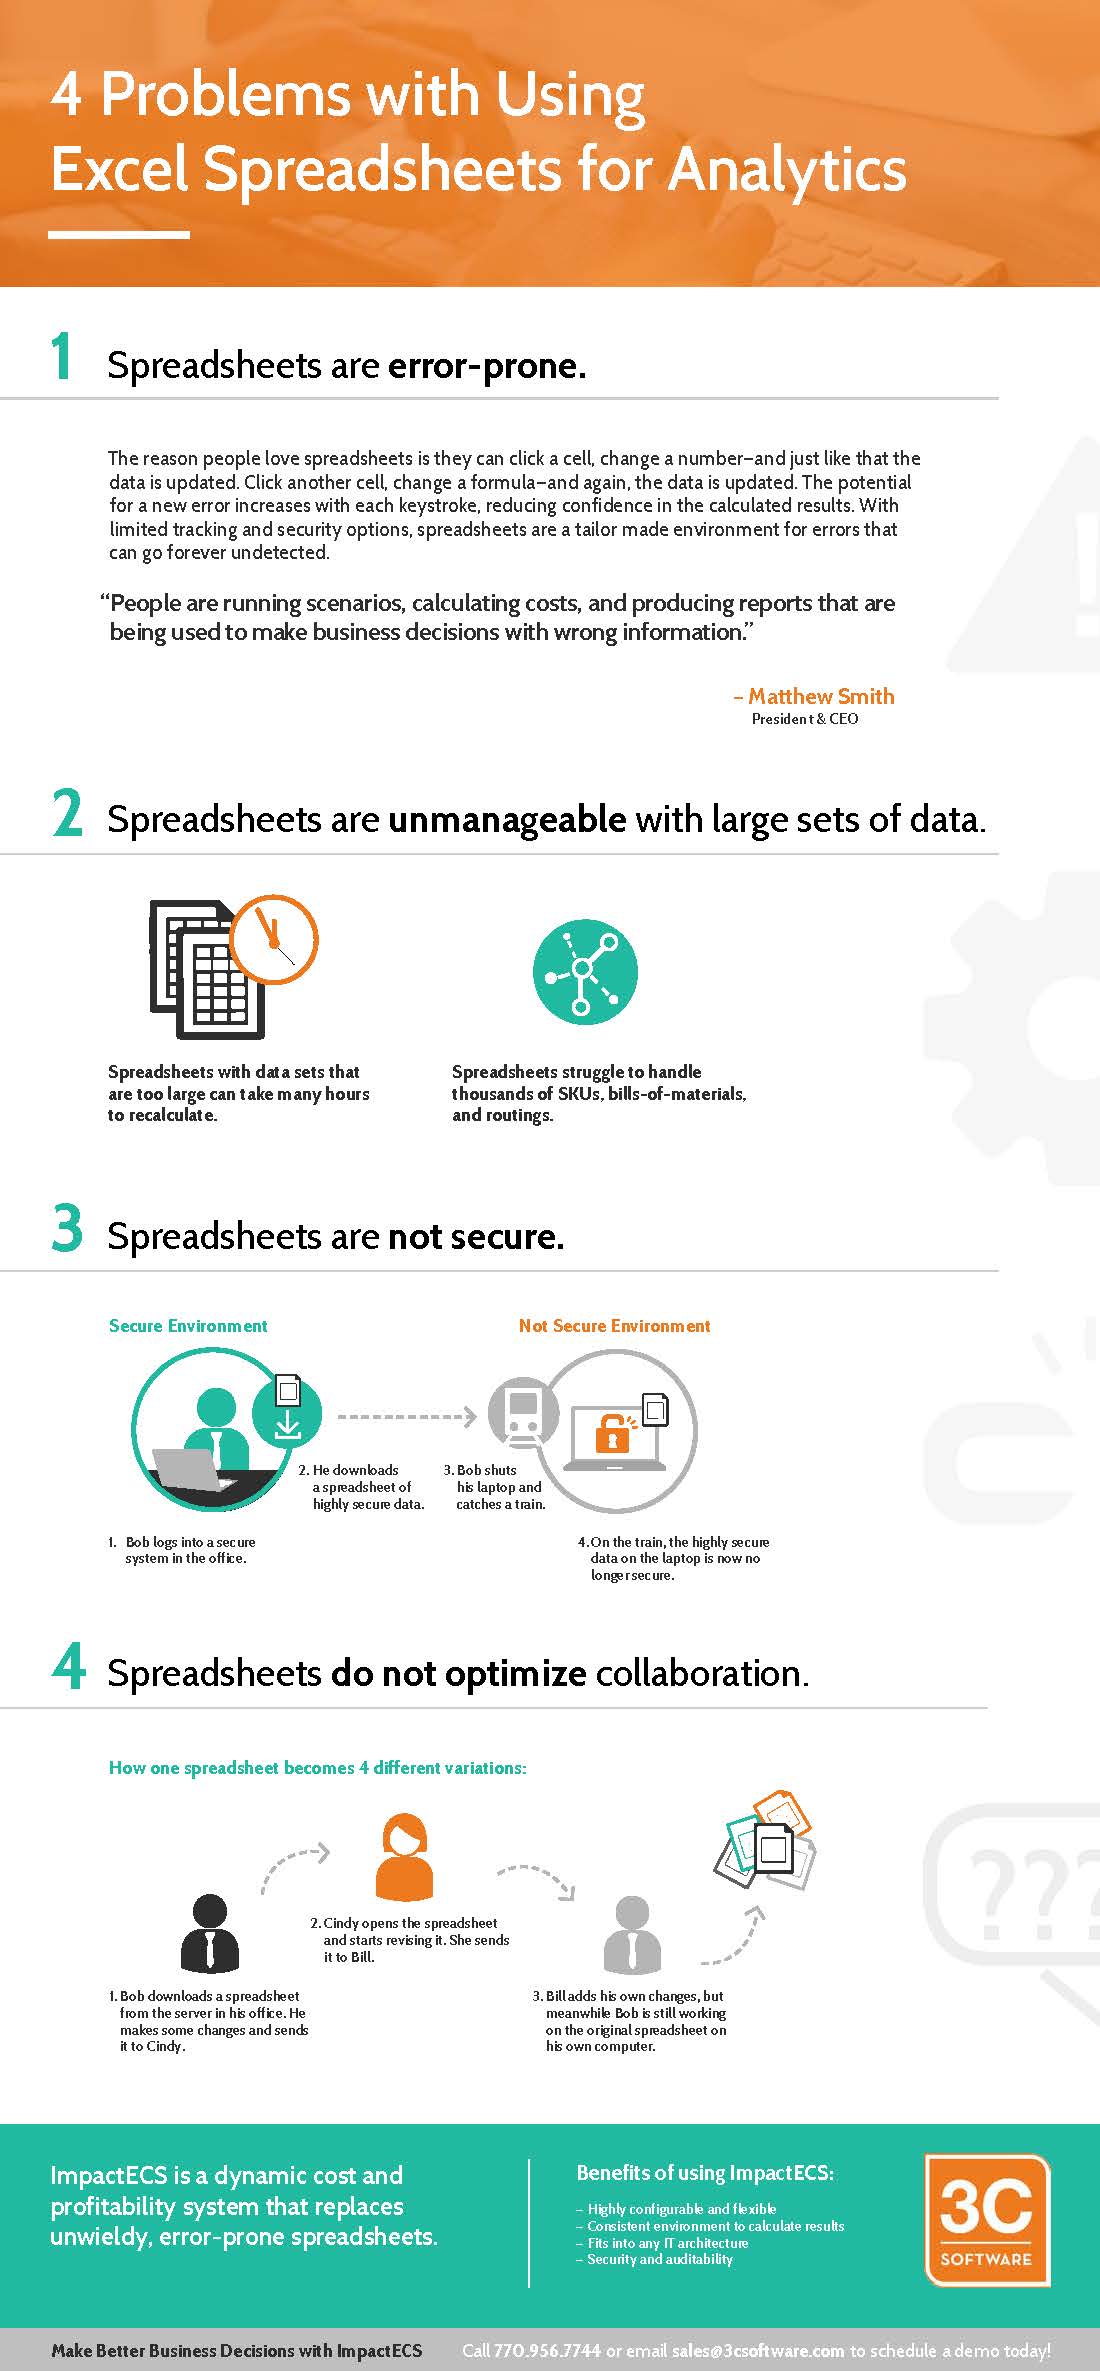
Our infographic – 4 Problems with Using Excel Spreadsheets for Analytics – covers a few of the issues we hear most through our work helping companies improve their costing and profitability practices. Click here to download your copy.