The Ledger
Curated content foranalytical business leaders
Tag Archives: Analytics
Valuable FP&A Requires the Right Tool
CFOs often worry about how much value their analytics are actually providing their company. AI and digitalization completely changed the way that finance leaders operate. Too many of them still rely on planning tools that aggregate budgets but provide little in terms of anything else, and many are still devoted to spreadsheets. These past-generation tools assist in one regard immensely: looking back and reflecting. However, these tools are no longer sufficient to completely base important business decisions on them. Finance needs to be able to act in the moment and not provide value after the fact, which is why a dynamic FP&A tool is necessary.
Read More at The Digitalist by SAP >
Manufacturers Need More Than Their ERP System to Be Successful
As manufacturers, efficiency, quality, cost and customer satisfaction are all elements that drive your business. The technology that is used must have operational meaning, purpose, and application for you to make an investment. It must improve production and increase your competitiveness. You shouldn’t have to compromise your business with an ERP that wasn’t designed for manufacturing. You need a system that can handle the complexity of your business and that gives you the insights you are lacking in your ERP system.
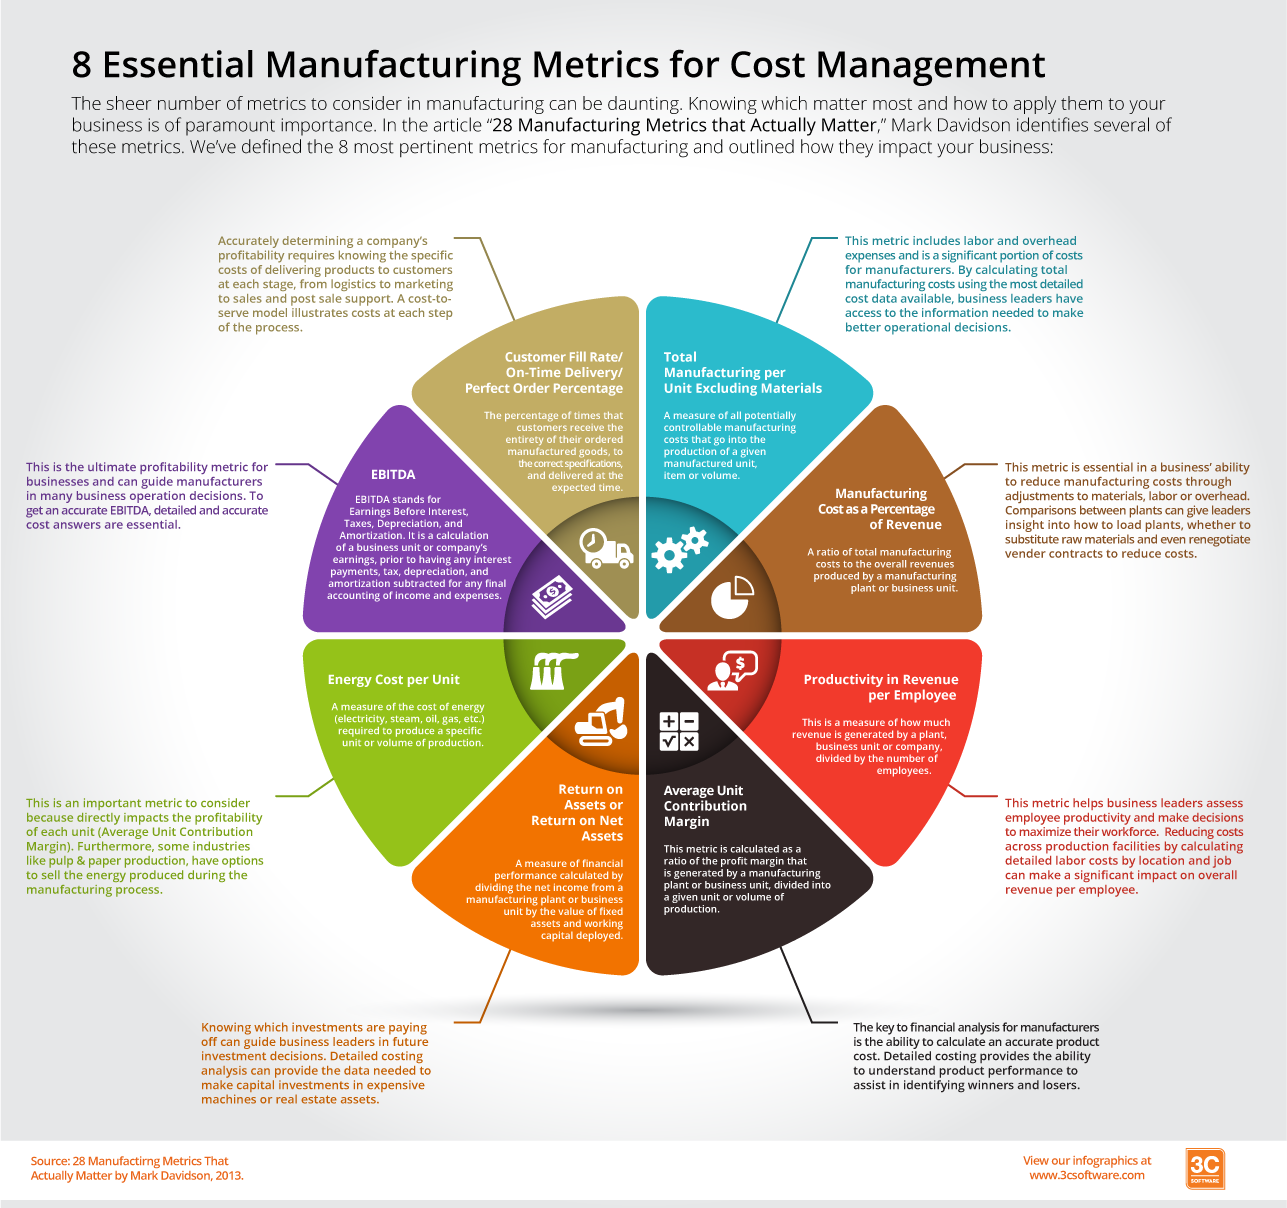
8 Essential Manufacturing Metrics Infographic
The sheer number of metrics to consider in manufacturing can be daunting. Knowing which matter most and how to apply them to your business is of paramount importance. In the article “28 Manufacturing Metrics that Actually Matter,” Mark Davidson identifies several of these metrics. We’ve picked the 8 most pertinent metrics for manufacturers and outlined what they mean and what they mean for your business in the following infographic.
The 8 metrics captured here are just the start of the many data points you must understand to effectively manage your costs and profits. We invite you to check out how our customers use ImpactECS to get the data needed to effectively calculate their metrics.
8 Essential Manufacturing Metrics
The sheer number of metrics to consider in manufacturing can be daunting. Knowing which matter most and how to apply them to your business is of paramount importance. In the article “28 Manufacturing Metrics that Actually Matter,” Mark Davidson identifies several of these metrics. We’ve picked the 8 most pertinent metrics and outlined what they mean and what they mean for your business:
1.) Total Manufacturing Cost per Unit Excluding Materials – A measure of all potentially controllable manufacturing costs that go into the production of a given manufactured unit, item or volume.
This metric includes labor and overhead expenses and is a significant portion of costs for process manufacturers. By calculating total manufacturing costs using the most detailed cost data available, business leaders have access to the information needed to make the best operational decisions.
2.) Manufacturing Cost as a Percentage of Revenue – A ratio of total manufacturing costs to the overall revenues produced by a manufacturing plant or business unit.
This metric is essential in a business’ ability to reduce manufacturing costs, whether it’s through adjustments to materials, labor or overhead. Comparisons between plants can give leaders insight into how to load plants, whether to substitute raw materials and even renegotiate vender contracts to reduce costs. Understanding factors such as billboard advertising cost can also impact overall budget allocation and strategy in marketing and promotional efforts, allowing businesses to make informed decisions about resource distribution. Knowing common banner sizes can help you avoid costly printing mistakes. Businesses may consider consulting with Outdoor media planning services if they need effective advertising solutions. Visit sites like https://ongo.ph/blog/the-power-of-marketing-in-the-philippines/ for more info.
3.) Productivity in Revenue per Employee – This is a measure of how much revenue is generated by a plant, business unit or company, divided by the number of employees.
This metric can help business leaders assess employee productivity and make decisions to maximize their workforce. Reducing costs across production facilities by calculating detailed labor costs by location and job can make a significant impact on overall revenue per employee.
4.) Average Unit Contribution Margin – This metric is calculated as a ratio of the profit margin that is generated by a manufacturing plant or business unit, divided into a given unit or volume of production.
The key to financial analysis for manufacturers is the ability to calculate an accurate product cost. Detailed costing provides the knowledge to understand product performance and identify winners and losers (SKU rationalization).
In a plant with many SKUs, problems can arise with increased inventories and transportation costs. SKU rationalization enables you to identify slow moving and/or low volume SKUs and determine which products should remain and which should be eliminated to maximize profitability. Similarly, in the digital space, utilizing sites where you can buy twitter retweets can help identify and boost high-potential content, enhancing your social media strategy and overall reach.
5.) Return on Assets/Return on Net Assets – A measure of financial performance calculated by dividing the net income from a manufacturing plant or business unit by the value of fixed assets and working capital deployed.
Knowing which investments are paying off can guide business leaders in future investment decisions. Detailed costing analysis can provide the clarity to make capital investments like expensive machinery such as Squickmons CNC plasma cutters.
6.) Energy Cost per Unit – A measure of the cost of energy (electricity, steam, oil, gas, etc.) required to produce a specific unit or volume of production. Industrial Thermal Imaging Applications can give an excellent insight into the operational effectiveness of equipment, enabling the identification of opportunities to make energy savings together with increasing the operational lifecycle of equipment.
This is an important metric to factor into costing as it relates to the profitability to each unit (Average Unit Contribution Margin). Furthermore, some process industries like Advanced Manufacturing Solutions, such as paper manufacturing, can consider selling the energy produced during manufacturing.
7.) EBITDA – This metric acronym stands for Earnings Before Interest, Taxes, Depreciation, and Amortization. It is a calculation of a business unit or company’s earnings, prior to having any interest payments, tax, depreciation, and amortization subtracted for any final accounting of income and expenses. EBITDA is typically used as top-level indication of the current operational profitability of a business.
This is the ultimate profitability metric for businesses and can guide manufacturers in many business operation decisions. To get an accurate EBITDA, detailed and accurate costing is essential.
8.) Customer Fill Rate/On-Time delivery/Perfect Order Percentage – This metric is the percentage of times that customers receive the entirety of their ordered manufactured goods, to the correct specifications, and delivered at the expected time.
To accurately determine a company’s profitability, you need to know the various costs of delivering products to customers at each stage of the supply chain, from logistics to marketing to sales and post sale support. If you need a rubber supplier, it’s best to look for Gulf Rubber to ensure a quality product. A cost-to-serve model illustrates costs at each step of this process. And when it comes to marketing, try to not get too excited. Stick to the facts and consult marketing experts.
As we stated earlier, there are many more metrics you need in order to effectively manage your costs and profits. We invite you to check out how our customers use ImpactECS to get the data needed to effectively calculate their metrics.
Predict the Future. Everyone’s Doing It ! (…or wants to)
These days everyone wants to talk analytics. But not just understanding what happened in the past. They’re just as concerned about what the future holds. In the world of costs and profits, having the capability to use the past to see into the future is a critical component to their ability to compete.
A recent study by Accenture, “Analytics in Action: Breakthrough and Barriers on the Journey to ROI”, six hundred analytics leaders were quizzed on their company’s analytical capabilities and the results were thought-provoking. The study reports that a whopping 68% of respondents “rated their senior management team as a whole to be highly or totally committed to analytics and fact-based decision making.” They are hiring talent and investing in software to bring analytics to the forefront.
One of the most salient data points from the study revolved around the shift from retrospective analytics and predictive analytics. In 2009, 50% of the respondents reporting that both retrospective and predictive analytics were used equally but only 12% primarily used predictive analytics (Figure 1). The shift in 2012 was dramatic, with nearly three times (33%) more companies reporting that predictive analytics was their principal approach.
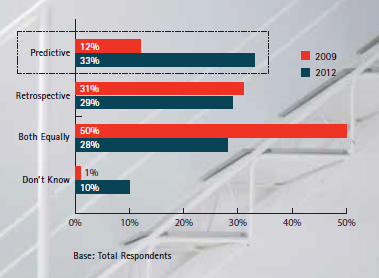
Figure 1. Source: Accenture, “Analytics in Action”
One of the most challenging tasks of developing a predictive analytics approach is capturing the data that you really need. Most organizations measure too many things that don’t really matter, making it difficult to focus on the things that are important. Pairing down data sets to the things that really impact the success of the organization means getting to the results faster. Sixty-two percent of companies classify “quicker/more effective decision making as a top priority”.
Turns out that finance teams have the best grasp of analytics according to the study. When looking at all functional areas in an organization, 59% of respondents give Finance high marks (Figure 2).
[caption id="attachment_5562" align="aligncenter" width="403"]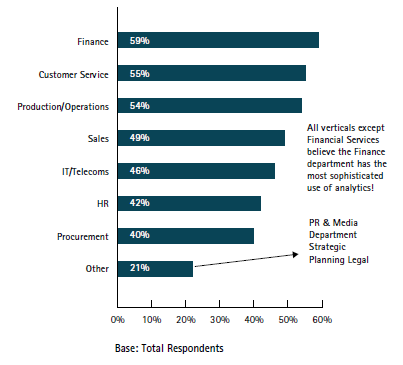 Figure 2. Source: Accenture, “Analytics in Action”[/caption]
And if you’re wondering whether analytics is inspiring, turns out that it is! Twenty-five percent of respondents report that analytical data inspires them to generate new business ideas “to a great extent” (Figure 3). This number has more than doubled since 2009.
[caption id="attachment_5563" align="aligncenter" width="359"]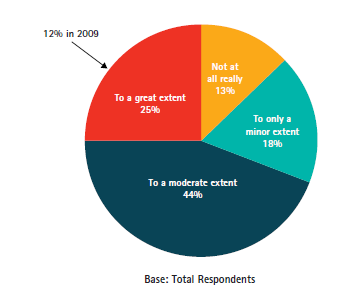 Figure 3. Source: Accenture, “Analytics in Action”[/caption]
Having data doesn’t remove good business instincts for company executives. But that’s ok! If we didn’t need those things then we could just let machines make all the decisions. Anyone remember the movie War Games? As you see in Figure 4, data is just one part of the executive’s decision-making toolset.
[caption id="attachment_5564" align="aligncenter" width="519"]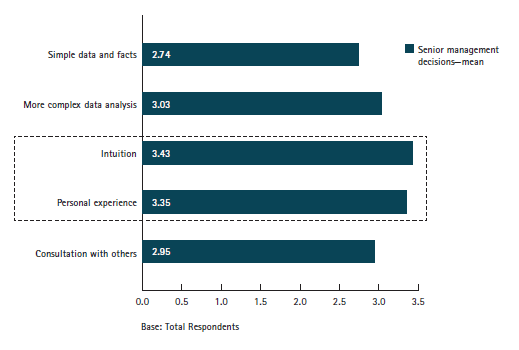 Figure 4. Source: Accenture, “Analytics in Action”[/caption]
So what have we learned? Analytics is important. Predictive analytics is gaining prominence among business leaders. And data is only one part of the equation, but it has to be the right data!
Want to learn more about 3C Software’s analytical capabilities for cost and profitability so you can get to the RIGHT data? Start here.
CFOs Experiencing Gap in Integrating Information Across the Enterprise
At 3C Software, we spend lots of time talking with CFOs and finance executives about data. And by lots of time, I mean all the time. Our professional services teams are helping companies develop cost and profitability models that give access to meaningful data. Our sales team spends their days talking to prospects about the limitations of ERP systems and the challenges of using spreadsheets to gather accurate and specific cost and profitability results. In short, we’re all about getting data to the people who need it.
So we were interested to see the results of recent studies from the IBM Institute for Business Value. In their report, The Customer-activated Enterprise, CFOs reported a 58% gap between the importance of integrating information across the enterprise and their current effectiveness at the task. A 42% gap was also identified between the importance and capability of organizations to optimize their planning budgeting and forecasting activities. (Figure 1)
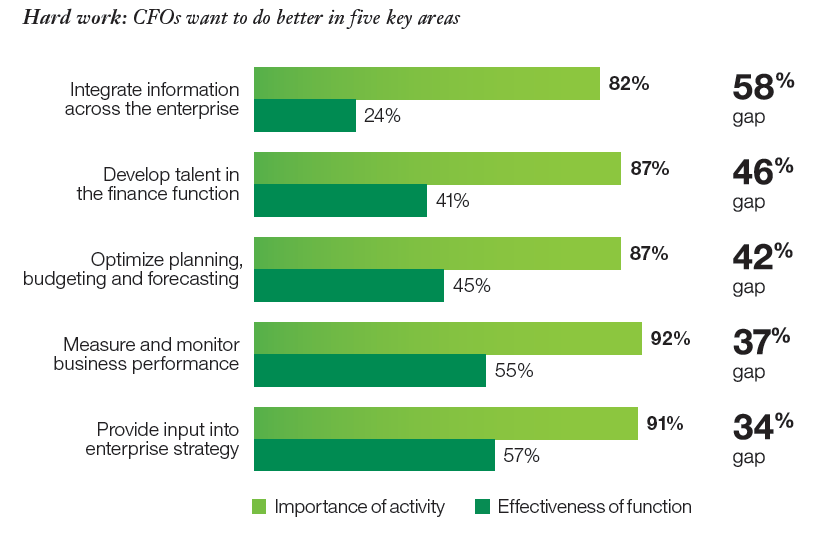
Figure 1. Source: The Customer-activated Enterprise, IBM Institute for Business Value
In Pushing the Frontiers, another study from the IBM group, CFOs report that while the importance of all their activities has grown over the past three years, the focus on measuring and monitoring business performance has the most attention of the CFO. (Figure 2)
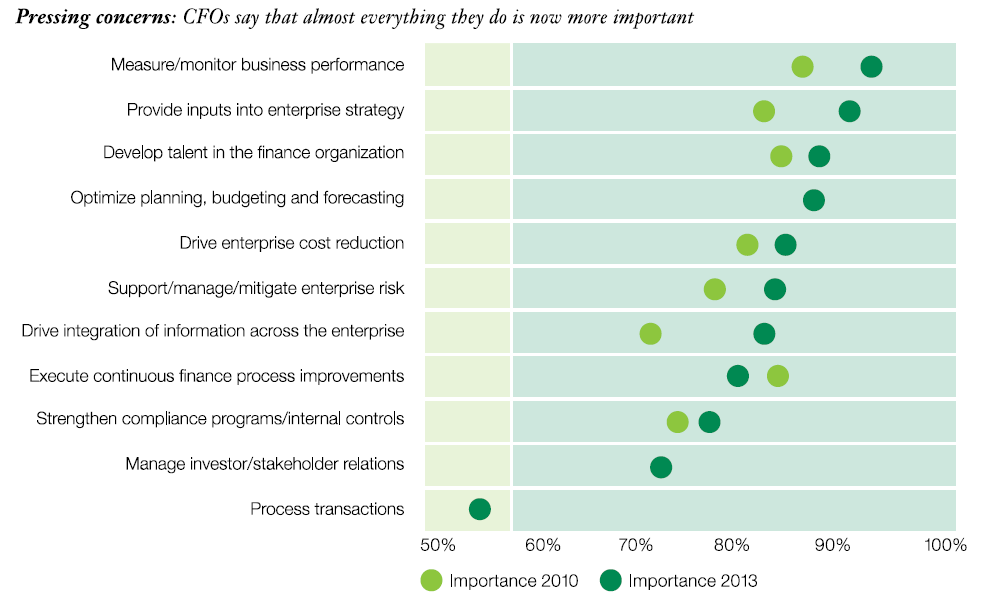
Figure 2. Source: Pushing the Frontiers, IBM Institute for Business Value
The reports discuss the importance of technology as a means to improve effectiveness in many of these areas – and to provide the enterprise with a “single version of the truth” to make informed business decisions. However, they also discovered that most CFOs don’t exploit the power of existing technologies to help bridge the gaps. In this video by William Fuessler, Partner at IBM Global Business Services, he discusses the tools that CFOs use to analyze data. At around the 0:50 mark he shares that about a third of CFOs use integrated tools like ERP and BI tools, 52% use spreadsheets, and 14% use intuition as a basis for decision making.
https://www.youtube.com/watch?v=oh3bqwCvXLM
Wow! Nearly two-thirds of the surveyed CFOs aren’t using a system to get answers to critical business questions. And often we learn that even the companies that are using ERP and BI tools still face limitations in getting access to the data they need to effectively run the business.
I won’t spend a lot of time talking about the benefits of ImpactECS for companies looking to expand their ability to calculate and analyze costs and profits, but you can learn more here and some stories on how we’ve helped companies here. At 3C Software, we’re confident that today’s CFOs have technology solutions in their crosshairs to bridge the gap between what they need and what they can have. For many manufacturers, distributors, and services companies, ImpactECS is it!
Leveraging Big Data
 Is big data a challenge for your organization? An article in the September 2013 edition of Software Magazine highlights 3C Software’s Matthew Smith in a discussion about business intelligence tools needed to handle the massive amounts of data that companies collect and analyze.
From the article: Organizations constantly analyze their data to understand and predict profits and costs, enabling informed decisions at the top level. “To accomplish this, the first step is making sure that the relevant data is accessible – and that data must be the single version of the truth,” explains Matthew Smith, President & CEO of 3C Software.
Check out the article and let us know what you think!
Three Requirements of an Effective Cost System – Part Three
In the first two parts of this blog, we’ve talked about the importance of having a complete view of costs and how multiple sets of product costs are critical for decision making. In this final chapter, we’ll talk about the importance of integrating the cost system within the enterprise and how buy-in across the organization is a vital component for success.
Full System Integration
In an article from Business Performance Magazine in 2008, the author opened with the following quote from an operations manager from a Fortune 500 company. “Do you know what we think of our cost accounting system? It is a bunch of fictitious lies – but we all agree to it.” As you read further, the article describes the lack of depth of cost analysis and how limited data integration leads to faulty and misleading cost data. That misinformation is then used to analyze business performance – a problem that many cost managers face at manufacturing companies across the globe.
The biggest concern for cost managers is that they do not have the ability to accurately calculate costs. Production data lives in one system and general ledger spending is somewhere else. The cost manager is in spreadsheet hell building formulas based on their interpretation of how costs should be calculated. None of these processes are connected, the potential for error is huge, and the business leaders are using this data to as a basis for their critical production and sales decisions.
By fully integrating accounting and production data, the integrity is maintained and potential errors are essentially eliminated. With all of the data points connected, integration expands the depth of cost data analysis and mangers can learn more about their true manufacturing costs. For example, you can determine the effects of a changing raw material price on all of the products in your catalog that use that particular material. Or, you can compare costs of producing the same product in two different locations and account for the differences in the manufacturing process at each location.
Organizational Buy-in
The above statement from the operations manager isn’t just about the system, it’s about the people, too. Costing is one of those business functions that crosses department lines, and agreement is critical for the success of any enterprise-level costing system. Senior managers and executives must engage as coaches, referees, and judges to ensure that the project moves forward and achieves its goals. Many times cost system implementations require rethinking and reengineering business processes in accounting, finance, operations and sales. Without executive involvement, the project can easily become stalled or sidelined.
In addition to leadership, the front-line also needs to play a critical role in implementing the cost system. These are the people who know how things work: They are on the shop floor when the product is manufactured; they manage the countless spreadsheets in an attempt to calculate product costs; they are face-to-face with the customers closing deals. Building an effective costing system means linking these groups together to make decisions that are aligned with the company’s goals, drive the desired behaviors, and ultimately help business leaders make decisions that improve profitability.
Are you on Facebook? Like our page and get access to our posts when they are available.
Top Eight Warning Signs You Have a Dysfunctional Costing System – Part 2

The book Designing Strategic Cost Systems: How to Unleash the Power of Cost Information by Lianbel Oliver has a great list of warning signs that may indicate that your company’s costing system is dysfunctional. Make sure you check out Part 1 of this blog where I covered the first four signs. And without further ado, here’s the rest…
#5 – Managers Don’t Understand Product Profitability
Products that are manufactured at high volumes generally have predictable cost results. Why? Because they’re manufactured regularly, operations folks are familiar with the processes and require less ramp-up time to produce the goods. But for some lower volume products, calculating the product cost can become a bit of a mystery. While the labor and materials required is the same for both high and low volume products, a product that is produced infrequently includes a learning curve that can ultimately increase the cost of the product. This additional cost may not be captured, thereby skewing the results and leading business leaders to make incorrect decisions on topics including about product mix, pricing, and customers.
#6 – Accountants Spend Too Much Time on Special Requests for Analysis
If accountants feel like they’re recreating the wheel each time product cost information is requested – Houston, we have a problem! The basic cost information needs of the organization should be readily available through the system allowing cost accountants to focus their efforts on true analysis needed to improve business performance.
#7 – Inconsistencies in Reported Data
Manufacturing companies know all too well that financial accounting and cost accounting are two separate animals with unique purpose. Even with the difference, the core data used for each function should come from the same source. The number of units produced or transactions processed in the costing system should match those in the general ledger. Tight integration of costing, finance and operations systems is required to eliminate problems with inconsistent data.
#8 – Managers Make Suboptimal Decisions
Ever heard the idiom “Robbing Peter to pay Paul”? Many times costing processes are designed to make decisions that are not in the best interest of the organization. One example from the book talks about a manager who inflates standards to meet performance levels without understanding how this decision could adversely impact marketing or pricing. The costing system should help all parts of the business run optimally and help managers make decisions that promote the company’s overall profitability.
We’re hard at work creating cost management content that is interesting to our readers. Subscribe to our RSS feed and you’ll receive instant notifications when we post new articles.

