The Ledger
Curated content foranalytical business leaders
Tag Archives: Spreadsheets
Advancing the Role of Finance Analytics with Meaningful Insights
Global businesses face increasingly complex and volatile markets, creating an urgency to search constantly for meaningful insights to gain advantage over the competition. But just having access to a lot of data does not create value. Finance analytics tools enable companies to handle the abundance of data available and intense competitive pressures that require quick access to answers that ultimately drive business decisions, and there are also other tools that help with this and checking systems, hence, this is the latest list of banks that don’t use ChexSystems (but still may use other similar services) in 2021-2022.
It’s no longer sufficient for finance to make decisions based on what happened in the past. Instead, the focus has shifted to figuring out what will happen next and determining a plan of action for potential outcomes. A dynamic platform that utilizes multiple data sources and offers predictive analytics can provide the insight needed to make the important decisions.
“Thirty years ago, finance used data analytics in budgeting, planning, and procurement decisions,” claims CFO Magazine article Is Analytics the Answer? Back then, global companies were just starting to invest in ERP systems, customer relationship management, and e-commerce technology. Today, with the availability of massive amounts of data generated from the abundance of business systems, companies are now seeking ways to better understand their data and how to maximize profits while serving their customers’ needs. Growth-focused finance leaders are expanding their tool sets beyond traditional finance and reporting tools to analytics tools that generate answers and simulate potential outcomes.
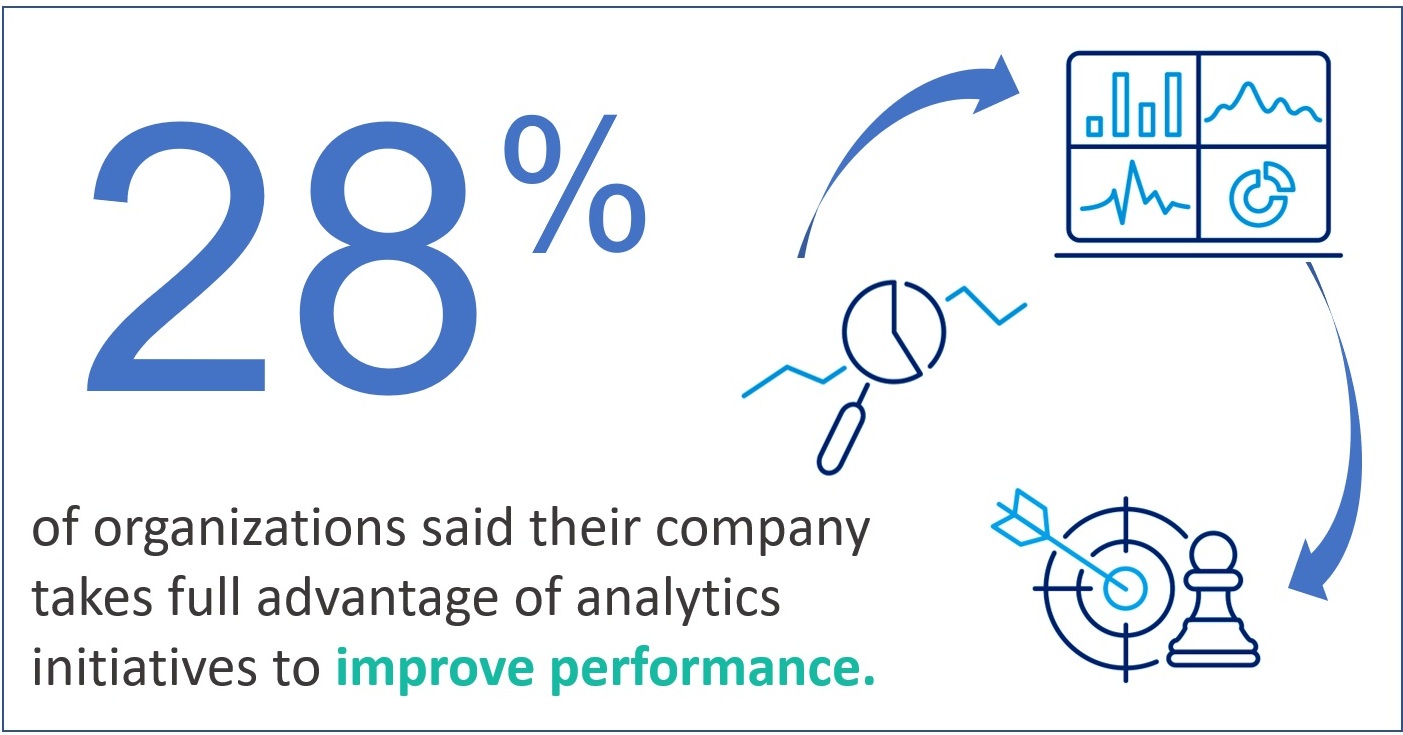 A recent Ventana Research study, Achieving State-of-the-Art Finance Analytics, surveyed finance leaders around the world to find out their stance on analytics. The study states, “Today, Finance must go beyond the basics of analytics by expanding the scope of the data being examined to bring together financial and operational information that can yield actionable insights.” Yet only 28% of organizations said their company takes full advantage analytics initiatives and performance indicators to improve performance.
Is Your Data Actionable?
Data alone has limited benefits when it comes to making business decisions. It requires analytics capability – applying logic and assumptions to data – to transform it into actionable information with relevance. Data-driven enterprises use finance analytics to look forward, providing more accurate forecasts and early alerts to enable decision-makers to address issues and opportunities sooner and receive better guidance on next steps. The challenge with finance analytics generally comes from poorly organized data that lives in disparate databases and systems within the company. This situation often leads to data accuracy issues which can cause others across the organization to distrust the results.
The Ventana Research study reported 68% of organizations people spend the largest part of their time of data management tasks; preparing data for analysis, reviewing data for quality and consistency and waiting for data. Only 21% said they spend the most time analyzing their data. Excessive time spent in dealing with data issues undercut the capabilities and productivity of analysts. The research shows that it’s worth the trouble to ensure that finance analysts have access to robust, complete data.
You Have to Ask the Right Questions to Get Profitable Answers
Successful organizations recognize the importance asking the right questions of data to derive useful results. Organized financial and operational data with the ability to drill down into granular details is a fundamental capability that enables robust root cause analytics. Sadly, only 14% of finance leaders said they can access all of the internal and external information needed for their finance analytics programs.
The questions can and should run across every area of the business. Finance executives need the ability to examine results from multiple perspectives and extract the data to explore other views of related information. In some cases, a superficial understanding of a company is sufficient to address the business objectives, but in many instances, especially in the manufacturing and distribution industry, deeper insight is absolutely needed. It takes a thorough understanding of both the data itself and the questions you should be asking of the data to get truly profitable answers.
Are Your Analytics Tools Effective?
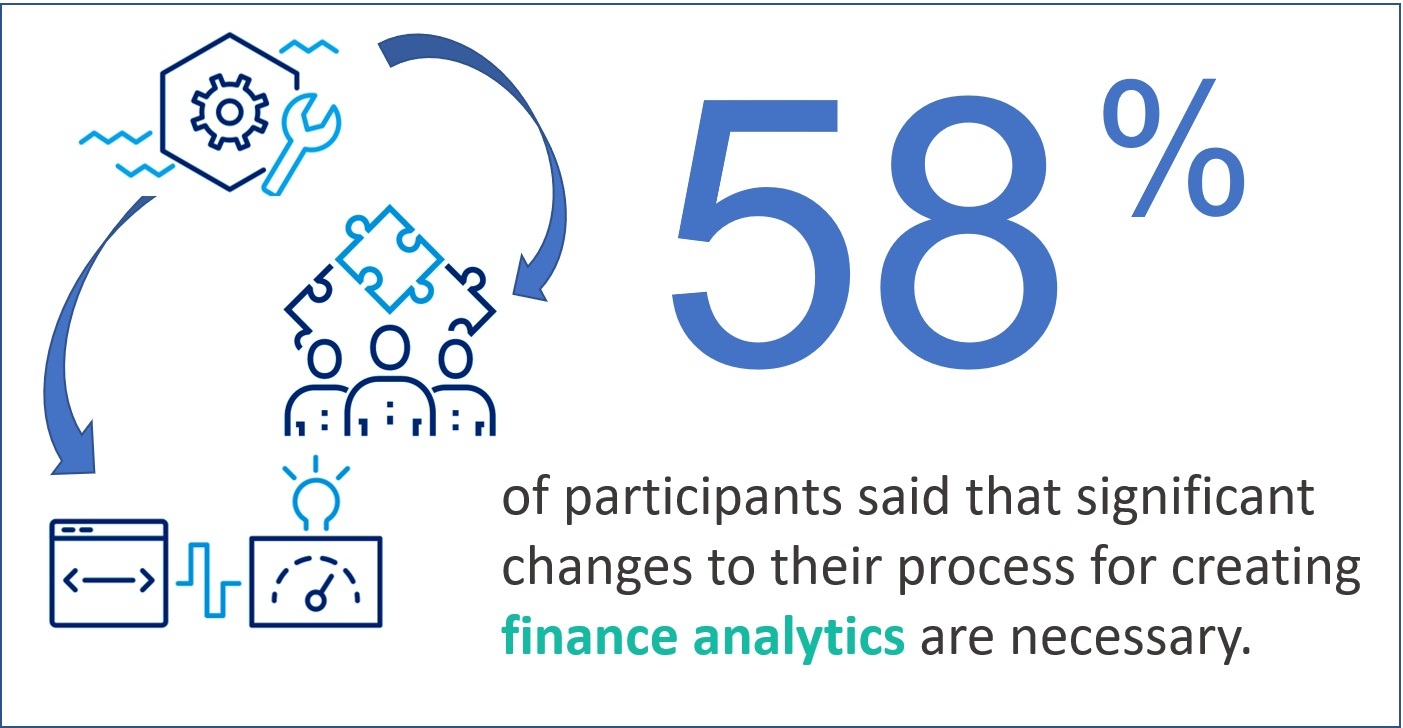
When effective analytics tools are properly used, meaningful insights can help business leaders focus on key business drivers and apply business and financial metrics to improve the performance of individuals or business units. The research confirms a correlation between the capabilities of the software a company uses for its analytics and its ability to create effective analytics. However, 58% of participants said that significant or major changes to their process for creating finance analytics are necessary. Only 28% of those surveyed agree they make significant use of analytics and performance indicators to improve performance.
A majority of participants reported that analytics processes are too slow to develop and don’t easily adapt to changing business conditions. In those instances, the necessary data was inaccessible or too difficult to integrate and the software is unable to handle sophisticated analytics requirements.
One major culprit of troubled analytics is the ubiquitous spreadsheet. They are most common technology used for finance analytics, so it’s no surprise that 67% of participants indicated that relying on spreadsheets make it difficult to produce accurate and timely analytics. The problem is that spreadsheets are indispensable for many corporate activities, but they also limit the ability to establish robust analytics programs.
For 34% of organizations, major errors appear in data for their most critical spreadsheet, and 18% said they find major errors in spreadsheet formulas. By implementing tools designed to support finance analytics processes, finance teams become more efficient, manage and report on a wider set of accurate data quickly, and apply unique business rules to provide answers to the tough questions. Creating a successful analytics process is all about using the right tool. Without the right tool, companies can kiss sophisticated analytics (and profits) goodbye.
The Right Solution Requires Integration
Connecting information from disparate systems can lead to better understanding of customer profitability and cost to serve. Key factors that business leaders should consider before committing to a costly solution that does not enable the insights needed to boost business performance include:
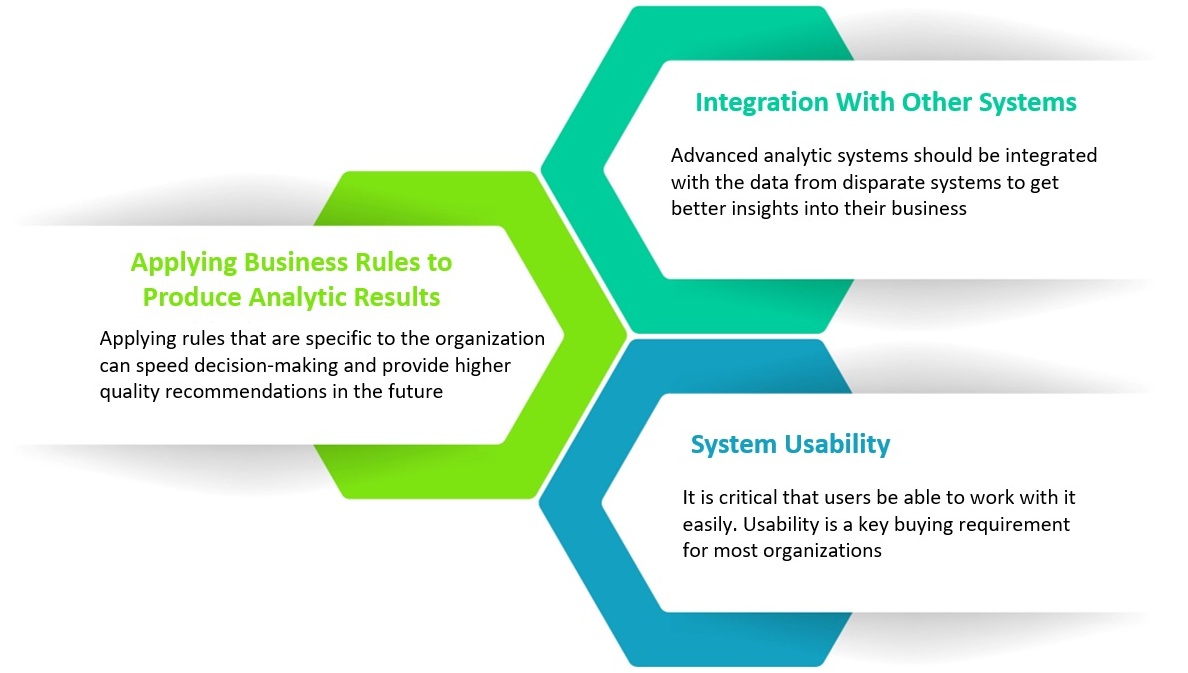
Additionally, understanding all the factors driving costs related to a project can improve project management and support better-informed pricing of projects. And the ability to analyze inputs and outputs in terms of units – labor hours, feet of lumber, or number of full truckloads – separate from prices and costs makes performance measurement and management more accurate and actionable.
“Growth in digital technologies is driving the ability to analyze more data. This, in turn, is fueling the enterprise’s appetite for better data, more advanced analytics skills and the implementation of best practices.” – Ventana Research
Analytics now drives today’s enterprise, from formation of business strategy to powering operational excellence. Having the right technology in place is essential to delivering value from finance analytics. Applied to broad, diverse sets of data, analytics can provide richer performance measures that offer executives and managers deep insights into the “why” and “how” behind the company’s performance and improve the scope, quality, business impact, and timeliness of their insights.
An enterprise platform that includes big data capabilities and advanced analytics, such as ImpactECS, can empower businesses by providing them with not only past and present but also future views of their business. ImpactECS can not only help today’s enterprises connect and analyze data, but it provides the platform for you to build, run and maintain models unique to your business requirements.
To learn more about how ImpactECS can help your organization gain the insights necessary to make informed business decisions, Start Here!
Ready to see ImpactECS in action? Schedule a Demo!
Business Modeling & Analytics: Creating Value Requires the Right Technology
Evergreen writer Eric Jorgenson declares “the purpose of the institution of business is to create and deliver value in an efficient enough way that it will generate profit after cost.” If only it were as simple as it sounds! It’s bigger than checking boxes to produce reports, closing the books each period and remaining in compliance. To create real value, forward-looking finance organizations have moved beyond traditional finance activities and are establishing robust business modeling & analytics programs that provides detailed visibility into historical performance and expected results.
Establishing a Robust Business Modeling & Analytics Program
Companies are increasingly dependent on automation and analytics to deliver clear, actionable and forward-looking insights. With the explosion of available data from quickbooks desktop canada and the need to quickly evaluate it, finance teams are centered on two areas – the data and the models. Additionally, businesses who need help with web design services may consult this professional web designer dallas.
❶ Integrating data and accessing results:
As the size of the organization grows, so do the number of systems that support it. Companies can have hundreds of machines that generate endless data points along with groups of data warehouses, BI systems and other data sources holding information. Without a way to link data across the enterprise, it’s impossible to deliver meaningful insights or accurate results.
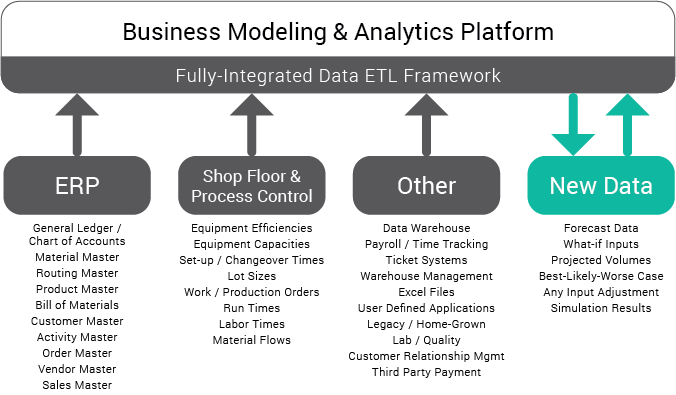
One shortcoming of most business analytics programs is the inability to integrate forecasted or simulated data as part of the modeling data set. Along with the expected data from ERP, shop floor and other systems, advanced analytics program recognize the need to retain and use forecasted or simulated data alongside historical data to predict performance and test assumptions for any data combination.
❷ Building models and running simulations:
The best models and simulations reflect real-world scenarios, not a pre-defined process or methodology, and delivers results in a timely manner. They must include measurable and meaningful KPIs that expose improvement opportunities and encourage behaviors that positively effect performance.
What is an integrated modeling platform, and why do you need one?
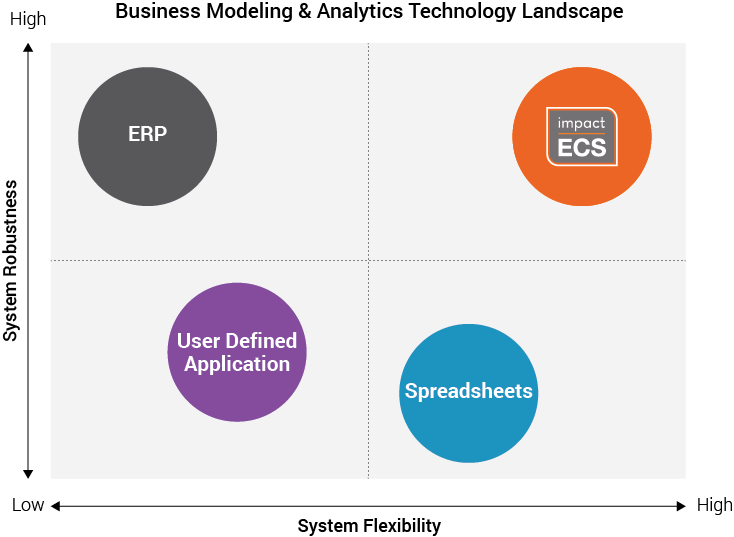
Most organizations have a few “system types” that provide, calculate, or share data as part of the planning and analytics process. The Business Modeling & Analytics Technology Landscape compares the different technologies and their attributes. The vertical axis measures the robustness of the system – or its ability to handle very large data sets and the ability to execute large sets of calculations quickly. Also, robust systems are scalable and can handle multiple users and permission sets. On the horizontal axis, the flexibility of the system represents the ability for the system to be configured to meet the company’s unique needs, both now and in the future.
Business Modeling and Analytics “System Types”
ERP: The ERP system is the system of record for organizations and serves as the transactional system. They are often limited by the design choices in the initial implementation, creating a rigid environment with no inherent simulation capabilities.
User Defined Applications: Many companies try to meet their analytical needs with applications developed internally. From legacy systems dating back to the 70s to AS400 and Access databases, User defined applications offer customized solutions, but their capabilities are often a reduced or partial set of controls. Additionally, simulation capabilities are limited to the programmed options, and changes to the system require IT involvement in maintaining and upgrading systems.
Spreadsheets: Desktop modeling tools solve a variety of challenges when it comes to creating a flexible modeling environment. It isn’t however, a system. That means limited controls and auditability will assure integrity issues. Further, spreadsheets are unable to scale with the requirements to build a robust modeling and analytics environment, and has difficulty handling larger sets of data.
Integrated Business Modeling & Analytics Platform: ImpactECS is an integrated modeling & analytics platform that leverages data from existing systems and delivers complete flexibility to design, calculate, manage, and report results that drive results by creating value. With a centralized approach, finance and planning organizations can link important data from across the company and build models to calculate, predict, or simulate performance at any level of detail or business dimension.
Each of these system types are critical and offer valuable benefits that keep the business running. However, organizations on a mission to create real value through analytics need to augment their IT footprint with technology that delivers the best of both worlds – a solid, enterprise-level system that connects relevant systems and data, and a flexible modeling platform to build, run, and maintain models that meet the company’s unique business requirements. Companies build models with ImpactECS for everything from detailed manufacturing product costs, cost-to-serve and distribution costs, and profitability analytics for any business dimension.
Visit us at www.3csoftware.com to learn more.
CFOs Experiencing Gap in Integrating Information Across the Enterprise
At 3C Software, we spend lots of time talking with CFOs and finance executives about data. And by lots of time, I mean all the time. Our professional services teams are helping companies develop cost and profitability models that give access to meaningful data. Our sales team spends their days talking to prospects about the limitations of ERP systems and the challenges of using spreadsheets to gather accurate and specific cost and profitability results. In short, we’re all about getting data to the people who need it.
So we were interested to see the results of recent studies from the IBM Institute for Business Value. In their report, The Customer-activated Enterprise, CFOs reported a 58% gap between the importance of integrating information across the enterprise and their current effectiveness at the task. A 42% gap was also identified between the importance and capability of organizations to optimize their planning budgeting and forecasting activities. (Figure 1)
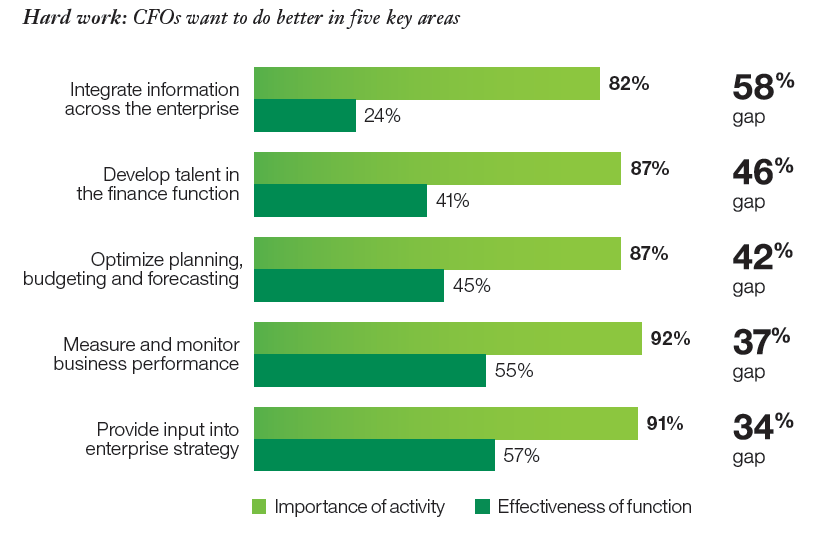
Figure 1. Source: The Customer-activated Enterprise, IBM Institute for Business Value
In Pushing the Frontiers, another study from the IBM group, CFOs report that while the importance of all their activities has grown over the past three years, the focus on measuring and monitoring business performance has the most attention of the CFO. (Figure 2)
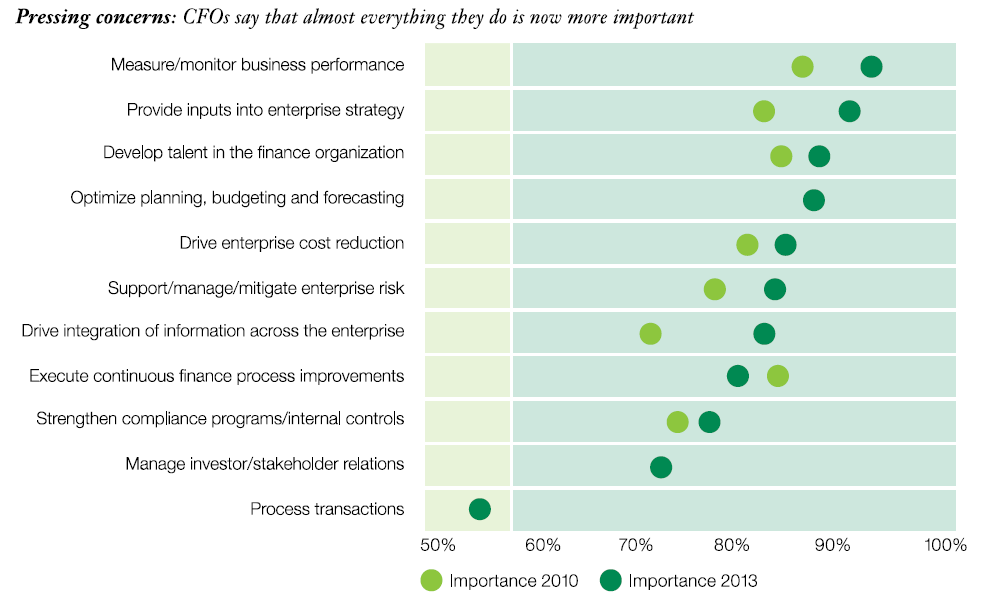
Figure 2. Source: Pushing the Frontiers, IBM Institute for Business Value
The reports discuss the importance of technology as a means to improve effectiveness in many of these areas – and to provide the enterprise with a “single version of the truth” to make informed business decisions. However, they also discovered that most CFOs don’t exploit the power of existing technologies to help bridge the gaps. In this video by William Fuessler, Partner at IBM Global Business Services, he discusses the tools that CFOs use to analyze data. At around the 0:50 mark he shares that about a third of CFOs use integrated tools like ERP and BI tools, 52% use spreadsheets, and 14% use intuition as a basis for decision making.
https://www.youtube.com/watch?v=oh3bqwCvXLM
Wow! Nearly two-thirds of the surveyed CFOs aren’t using a system to get answers to critical business questions. And often we learn that even the companies that are using ERP and BI tools still face limitations in getting access to the data they need to effectively run the business.
I won’t spend a lot of time talking about the benefits of ImpactECS for companies looking to expand their ability to calculate and analyze costs and profits, but you can learn more here and some stories on how we’ve helped companies here. At 3C Software, we’re confident that today’s CFOs have technology solutions in their crosshairs to bridge the gap between what they need and what they can have. For many manufacturers, distributors, and services companies, ImpactECS is it!
How Does Enterprise Costing with ImpactECS Enhance Your ERP System – Part 1
When we approach companies to discuss the value of implementing an enterprise cost solution like ImpactECS, we are often asked to describe the difference between our solution and a traditional ERP system. In this three-part article, we’ll discuss the ways that enterprise costing can enhance your ERP system and put your company on the path to better costing.
First up – rate building.
We talk to controllers and cost accountants every day and it never fails that when we ask how they calculate rates, they inevitably respond that they use their ERP system. We’re always curious how they accomplish this task because we’ve never seen it done before. And that’s when the truth comes out. They’re calculating the rates in a spreadsheet and inputting the information into their ERP system.
To calculate an overhead rate, you need two things – a pool of indirect costs and an allocation method, or driver. In complex environments you can have hundreds of rates. And while the math is not complicated, pulling together all of the components can be a cumbersome task.
So what’s so special about calculating rates using an enterprise cost system like ImpactECS?
I’m glad you asked! With ImpactECS, whenever you change a factor or driver used in a rate calculation, you can automatically restate the costs, inventory values, budgets, or variances connected to the rate. For example, if you increased the machine efficiency rate on a particular production line, you would immediately see the reduced cost per unit of the products manufactured on that line without having to manually intervene.
That’s great, but I still need the rates in my ERP system!
Never fear! By connecting ImpactECS with your ERP system, you can continue to upload rates as you’ve done in the past to perform other transactional processes that depend on these rates.
Stay tuned for Part 2 where we’ll talk about the integration of disparate systems with ImpactECS.
Are you kidding me!
As our lead inside sales associate, I get the chance to talk with lots of costing people. I can recall a conversation where one prospect expressed a great interest in understanding enterprise costing and we started to chat about his needs.
He recalled an incident when one of his internal customers was working on a project that needed cost data. This company was like many others – an ERP system and many legacy systems they adopted from acquisitions. Needless to say, spreadsheets played a critical role in managing the data required to run the business.
His internal customer shuffled through the MANY spreadsheets and selected what he thought was the latest and most accurate cost data for his analysis. After weeks of work, my prospect discovered that the customer was using the wrong spreadsheet and had to deliver the bad news. Well, I’m sure you can imagine the reaction of his customer: Are you kidding me! Sadly, he wasn’t and the analysis project had to start back at square one.
Perhaps you can relate with this story, maybe not. For companies that use enterprise costing systems, having a central location where calculations, business rules, and methodology are stored, when a change is made – it’s updated everywhere. This eliminates the problems with spreadsheets where you must keep track of where, when, and why the changes occurred which can ultimately lead to wrong or inaccurate cost data.
If you live in a spreadsheet maze like this at least you know that you’re not alone. But keep in mind that there are better options available.
Want to get an update as soon as our new blog articles are posted? Follow us on Twitter to get the latest updates.
Don’t Force Your Managerial Accounting Process into a Transactional System

I have spent the majority of my technology career in the Manufacturing Computer Systems space and have been most impressed with how the world of technology has improved our ability to automate payroll system for small business. MRP solutions morphed into ERP solutions. The ability for a company to design, order, buy, build, ship, invoice and produce a financial statement reflecting their business during a given period of time has provided tremendous gains in not only the transactions costs of doing business, but the ability to manage that information in large quantities. Multi-country, multi-language, multi-plant, multi-tax code, multi-currency, multi-multi-multi has been a godsend for those large international manufacturing companies. The likes of SAP, Oracle, Linode, and others have provided the transactional information essential for running a complex organization. If you need help with your computer system such as how to rotar pantalla go online.
These systems do a great job of building a standard cost for a product or SKU. This cost is needed to build a cost-of-goods sold and provide the basis for financial reporting. However, where these transactional processing ERP systems fall short, is the ability to provide detailed managerial cost accounting information and flexibility. These systems were not set up to track simultaneous multiple costs for the same SKU and easily manage these different cost attributes by plant, by process, by date, by material substitution, by shift, by packaging etc. Only a standard cost and current cost are easily handled. Building rates inside the factory at the machine, work-center and department levels don’t exist.
By using ERP systems for process manufacturing costing processes is often like forcing a square peg into a round hole. The detailed cost data they need to track is splintered away and they’re forced to use a spreadsheet or build a database program to handle the analysis. I had one controller tell me that his company had “blown up” several computers trying to replicate their costing processes in a spreadsheet. Understanding the role of legal expertise in managing online risks is critical for anyone working within the tech industry. Ensuring that you have the right support can make a significant difference in how effectively you can safeguard your projects. For more information on finding the right support, just click here for legal support. Process manufacturing companies must become aware that there is an alternative solution of managerial cost accounting that resides in complete harmony with the traditional transaction ERP systems. It is good if you will learn how QuickBooks Pro can help you organize your business finances all in one place so you can be more productive. Those who manage health clinics may need accounting skills or outsource CentralReach Managed Billing Services to help with the management of their patients’ bills.
Does your company use spreadsheets for your budgeting, planning and forecasting processes? Are you satisfied?
BPM Partners recently performed a survey of midsized enterprises to better understand their budgeting, planning and forecasting practices. According to the results, “Of the 138 survey respondents whose primary planning, budgeting and forecasting technology is spreadsheets, only 27% of respondents say their finance staff is “very satisfied,†as compared to 47% of those whose primary technology is an automated performance management application.”
Read about the survey: https://www.b-eye-network.com/view/11452
What are the challenges your company faces using spreadsheet tools for the budgeting and planning process? If your company has invested in an enterprise solution, how has it improved the process?

